Neighborhood Employment & Household Mix Across America
Explore how the balance between employment opportunities and nearby households varies across neighborhoods in dozens of U.S. cities. Employment & Household Mix is one of the four variables used in the EPA National Walkability Index because neighborhoods with a healthy balance of jobs and residents often support shorter trips, mixed-use development, and more walkable communities.
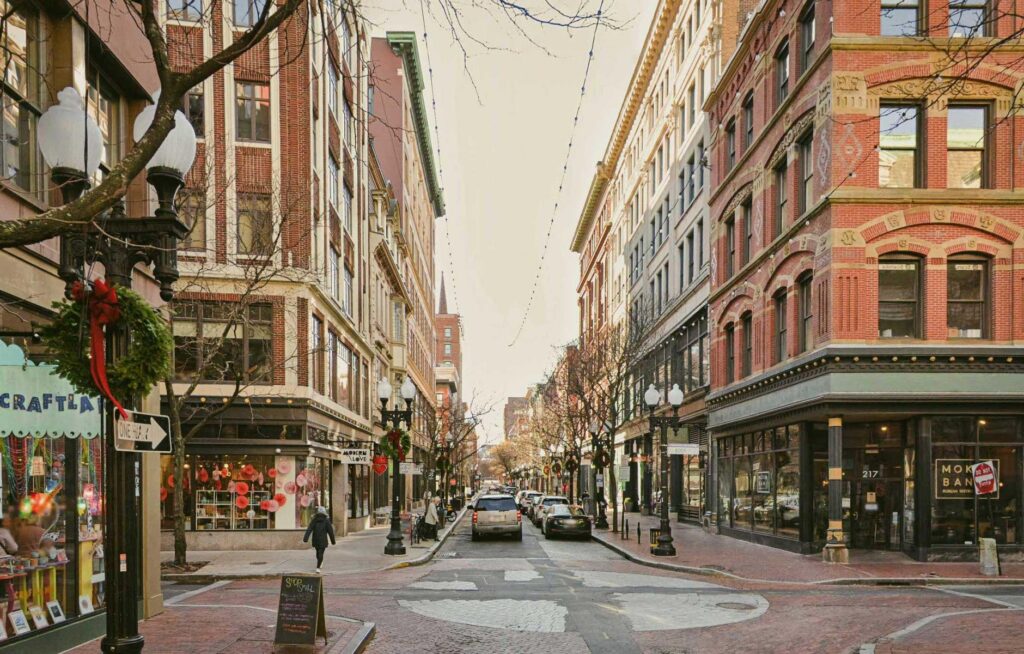
Providence’s downtown around Westminster Street demonstrates a high Employment & Household Mix through the integration of housing, offices, restaurants, retail, and civic spaces within a compact, walkable street network. The city’s renaissance reflects decades of planning, adaptive reuse, and investment that transformed underutilized historic buildings into vibrant mixed-use destinations. This photo is adapted from Henderson (2025).
Quick Statistics
2,740
Neighborhoods Analyzed
10.51
Average Employment & Household Mix Score
1-20
Observed Employment & Household Mix Range
Other Variables of the National Walkability Index- Neighborhood Level
Neighborhood Walkability
Explore neighborhood-level walkability to identify local variations in accessibility, connectivity, and the built environment within municipalities.
Neighborhood Intersection Density
Compare street connectivity across neighborhoods to identify highly connected areas that support safer and more direct pedestrian travel.
Neighborhood Transit Accessibility
Evaluate neighborhood access to nearby transit stops and identify communities with stronger connections to public transportation.
Neighborhood Employment Mix
Analyze how employment opportunities are distributed within neighborhoods and how local land uses support walkability.
Further Reading
Key Takeaways
- Employment and Household Mix measures jobs-housing balance rather than the quantity of jobs or housing. Neighborhoods score highest when employment opportunities and residential households occur together in a balanced pattern.
- The highest scores are concentrated in mixed-use urban centers. Downtowns, university districts, transit-oriented developments, historic commercial neighborhoods, and redeveloping mixed-use districts consistently exhibit the strongest integration of housing and employment.
- Specialized land uses often receive lower scores. Airports, industrial districts, parks, reservoirs, military facilities, and exclusively residential neighborhoods typically exhibit lower jobs-housing balance because they primarily serve one dominant function.
- Balancing housing and employment supports more sustainable travel behavior. Planning research consistently finds that neighborhoods integrating jobs and housing reduce commuting distances, encourage walking, support transit, and decrease automobile dependence (Cervero & Kockelman, 1997; Frank et al., 2005; Ewing & Cervero, 2010).
- Employment and Household Mix is one component of neighborhood walkability. The most complete understanding of accessibility comes from evaluating this variable alongside intersection density, proximity to transit, employment diversity, and on-the-ground pedestrian conditions.
Neighborhoods-Distribution of EPA Employment/Household Mix Scores
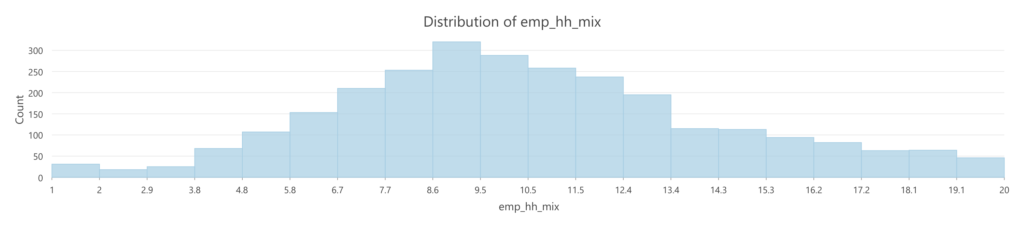
Distribution of EPA Employment/Household Mix Scores for U.S. Neighborhoods:
- Sample size (2,740 Neighborhoods)
- Mean = 10.51
- Median = 10
- Min = 1
- Max = 20
- SD = 3.85
Neighborhood Employment–Household Mix Analysis
Classification Categories
The American Walkability Atlas classifies neighborhoods into five categories based on their Employment and Household Mix scores. This variable measures the balance between employment opportunities and residential households within a neighborhood. Rather than evaluating employment diversity or housing density independently, Employment and Household Mix examines how closely jobs and housing are located together. Within the EPA’s National Walkability Index, neighborhoods where employment and housing are more evenly balanced generally provide greater opportunities for walking because residents can reach workplaces, businesses, services, and other destinations without traveling long distances.
Planning research has consistently shown that balancing employment and housing supports shorter trips, increases transportation choice, and encourages walking by reducing the separation between where people live and where they work (Cervero & Kockelman, 1997; Frank et al., 2005; Ewing & Cervero, 2010).
- Extremely Low Balance: Areas with an extremely uneven distribution between employment activity and occupied housing and/or very limited diversity among employment types. These locations represent the lowest relative level of employment and household mix.
- Very Low Balance: Areas with a very limited mix of employment and occupied housing. One component may be substantially more prominent than the other, or employment may be concentrated among relatively few categories, resulting in very low overall diversity.
- Low Balance: Areas with some combination of employment and occupied housing but relatively limited diversity or balance among these activities. Both may be present, although their overall mix remains comparatively low.
- Moderate Balance: Areas with an intermediate mix of employment and occupied housing. Housing and employment both contribute to the area’s activity, with a moderate degree of diversity among employment types and residential uses.
- Above Moderate Balance: Areas with a relatively strong mix of employment and occupied housing. These locations exhibit greater diversity and balance among residential and employment activities than areas in the middle range.
- High Balance: Areas with a diverse combination of employment types and occupied housing. The relatively strong mixture of residential and employment activity represents built-environment conditions that are more supportive of walking.
- Very High Balance: Areas with the greatest relative mix of diverse employment types and occupied housing. These locations represent the highest level of employment and household diversity measured by this component of the National Walkability Index.
Planning Implications
Employment and Household Mix is one of the most important indicators of neighborhood accessibility because it measures whether people can live near the places where they work and conduct daily activities. Communities that successfully integrate housing with employment opportunities generally produce shorter trips, reduce automobile dependence, support transit ridership, and encourage walking.
The planning literature has consistently identified jobs-housing balance as a key component of sustainable urban development. Cervero and Kockelman (1997) demonstrated that land-use diversity influences travel behavior, while Frank et al. (2005) found that neighborhoods containing balanced land-use patterns promote greater physical activity and lower automobile use. Likewise, Ewing and Cervero (2010) concluded that mixed land-use environments contribute significantly to increased walking and reduced vehicle travel.
Neighborhoods with High and Very High Employment and Household Mix often benefit from planning policies that preserve mixed-use zoning, encourage infill development, support neighborhood-serving commercial uses, expand housing choices near employment centers, and improve multimodal transportation connections. Maintaining this balance allows neighborhoods to remain active throughout the day while supporting local businesses and reducing regional commuting demands.
Neighborhoods with Low or Very Low Employment and Household Mix may benefit from policies that gradually introduce complementary land uses. Residential neighborhoods can become more walkable by allowing neighborhood-scale commercial development, offices, civic facilities, and services, while employment centers can improve accessibility by incorporating housing opportunities. However, planners should recognize that certain specialized districts—including airports, ports, industrial parks, military installations, universities, and regional parks—serve unique functions that naturally produce lower jobs-housing balance and should not necessarily be viewed as planning deficiencies.
Employment and Household Mix should always be interpreted alongside street connectivity, transit accessibility, and employment diversity to provide a comprehensive understanding of neighborhood walkability.
Understanding Neighborhood Walkability
Employment and Household Mix contributes to neighborhood walkability by measuring how closely residential development and employment opportunities occur together. When neighborhoods provide both places to live and places to work, residents often have shorter travel distances and greater opportunities to complete multiple daily activities without relying exclusively on automobiles.
Unlike municipal averages, neighborhood-level analysis reveals substantial variation within cities. One neighborhood may consist almost entirely of housing, while another may function primarily as an office district or industrial center. Mixed-use neighborhoods that successfully integrate residential development with employment opportunities generally support more continuous pedestrian activity throughout the day because people live, work, shop, dine, and access services within the same area.
High Employment and Household Mix generally supports:
- Shorter commuting distances.
- Greater opportunities for walking and bicycling.
- Higher transit ridership.
- More active streets throughout the day.
- Stronger neighborhood business districts.
However, Employment and Household Mix alone does not guarantee walkability. A neighborhood with a balanced mix of jobs and housing may still experience poor pedestrian conditions if sidewalks are incomplete, streets prioritize high-speed traffic, intersections are widely spaced, or transit service is limited. Likewise, predominantly residential neighborhoods may still provide excellent pedestrian environments when supported by connected street networks, parks, schools, and neighborhood commercial centers. Consequently, Employment and Household Mix should be interpreted alongside the other components of the National Walkability Index.
Geographic Patterns in Neighborhood Walkability
The neighborhood-level Employment/Household Mix results reveal substantial variation in the balance between employment opportunities and residential activity across the study area. Across all 2,740 neighborhoods, the average Employment/Household Mix score is approximately 10.51, with a median of 10.00. Scores extend across the complete 1.00–20.00 range, demonstrating that neighborhoods vary considerably in the extent to which employment and households coexist within the same area. The dataset identifies this measure as emp_hh_mix.
Using the same seven fixed intervals with an interval size of approximately 2.857143, the distribution is strongly concentrated in the middle categories. 49 neighborhoods (1.8%) fall between 0–2.86, 196 (7.2%) between 2.86–5.71, 615 (22.4%) between 5.71–8.57, 869 (31.7%) between 8.57–11.43, 549 (20.0%) between 11.43–14.29, 289 (10.5%) between 14.29–17.14, and 173 (6.3%) between 17.14–20.00. The largest concentration therefore occurs in the 8.57–11.43 class, which alone contains nearly one-third of all neighborhoods.
Taken together, the three middle classes from 5.71 through 14.29 contain 2,033 neighborhoods, or approximately 74.2 percent of the dataset. This indicates that most neighborhoods exhibit some degree of balance between employment and residential activity without reaching either extreme. Only 9.0 percent fall within the two lowest classes, while approximately 16.8 percent occupy the two highest classes.
Geographically, Employment/Household Mix tends to be relatively strong in downtowns, mixed-use districts, commercial-residential centers, and neighborhoods where employment concentrations occur alongside residential populations. Among the 52 neighborhoods containing “Downtown” in their names, the average score is approximately 14.92, considerably higher than the overall neighborhood average of 10.51. This suggests a meaningful relationship between traditional mixed-use urban centers and stronger Employment/Household Mix scores, although substantial variation remains between individual downtowns.
Several downtown examples illustrate this pattern. Portland, Maine Downtown scores 19.50, Shreveport’s Downtown Riverfront 19.00, Irving Downtown approximately 18.33, Stockton Downtown 18.25, Eugene Downtown 18.50, Baton Rouge Downtown 17.00, Portland, Oregon Downtown approximately 16.89, Dallas’ Central Business District approximately 16.83, Los Angeles Downtown approximately 15.87, San Diego Downtown approximately 15.57, Houston Downtown 15.60, and San Angelo Downtown 15.00.
Unlike a measure based solely on employment diversity, Employment/Household Mix provides insight into the relationship between jobs and residential activity. A major employment center may contain many jobs but relatively few households, while a predominantly residential neighborhood may contain many households but comparatively little employment. In either situation, the imbalance between the two functions can influence the resulting score. Neighborhoods where residential and employment activities are more effectively combined can therefore perform differently from areas dominated almost exclusively by one use.
Los Angeles demonstrates this geographic complexity particularly well. Downtown scores approximately 15.87, but several other neighborhoods also receive high scores, including Playa Vista (18.00), Fairfax approximately 16.69, Beverly Grove 16.35, Chinatown 15.50, and West Los Angeles 15.00. At the opposite end, Chatsworth Reservoir receives the minimum score of 1.00, while other neighborhoods occupy a broad range between these extremes. This pattern shows that high Employment/Household Mix is not exclusive to a city’s traditional downtown.
San Angelo again provides a useful example of substantial within-city variation. Blackshear scores 18.00, Fort Concho 17.50, the Bluffs 17.25, Goodfellow Air Force Base 16.00, Riverside 15.00, Downtown 15.00, and Santa Rita approximately 14.17. By comparison, Belaire scores approximately 2.33, Angelo Heights 5.00, Lake View 6.00, Bonham 6.50, and Central 8.00.
Waco displays a similarly broad range. Richland Hills scores approximately 19.67, Austin Avenue 17.00, Airport approximately 16.67, Kendrick approximately 15.33, Heart of Texas 15.00, East Riverside 15.00, and University 14.00. Downtown receives a more moderate 12.50. Lower values occur in Landon Branch (4.80), Carver (5.40), Dean Highland (5.60), North Waco approximately 6.33, and Brookview 7.50.
The Dallas results further demonstrate that some of the strongest Employment/Household Mix scores occur outside the conventional central business district. The Central Business District scores approximately 16.83, while Cedars reaches the maximum 20.00, Deep Ellum 19.00, Knox/Henderson approximately 18.33, Victory Park 16.00, and Uptown approximately 14.63. Meanwhile, Dells District scores 1.00, Dallas College Mountain View Area 2.00, and several southern and southwestern neighborhoods occupy substantially lower categories.
These patterns reinforce an important distinction between Employment Mix and Employment/Household Mix. Employment Mix focuses on the diversity of employment represented within a neighborhood, whereas Employment/Household Mix captures a different dimension: the relationship between employment and residential activity. A neighborhood can therefore contain diverse employment types while still having a relatively weak employment-household balance, or it can combine substantial residential and employment activity without possessing the greatest diversity of employment categories.
The lowest-scoring areas also require careful interpretation. A low Employment/Household Mix score does not automatically indicate poor planning. Predominantly residential neighborhoods, industrial districts, airports, parks, open-space areas, institutional campuses, and other specialized land uses may naturally contain an uneven relationship between employment and households. For example, Long Beach’s El Dorado Park South scores 2.00, while Rancho Estates scores 3.00; Los Angeles’ Chatsworth Reservoir scores 1.00. These scores should therefore be interpreted in relation to the intended function and physical characteristics of each neighborhood.
Overall Pattern
Overall, Employment/Household Mix exhibits the strongest concentration in the middle of the seven-class distribution. The 8.57–11.43 class contains 869 neighborhoods (31.7%), making it the largest category. It is followed by 5.71–8.57 with 615 neighborhoods (22.4%) and 11.43–14.29 with 549 neighborhoods (20.0%). Collectively, these three classes contain approximately three-quarters of all neighborhoods.
The extreme categories are substantially less common. Only 49 neighborhoods (1.8%) occupy the lowest class, compared with 173 neighborhoods (6.3%) in the highest. The resulting distribution suggests that extreme employment-household imbalance and exceptionally strong balance are both less common than the moderate conditions characterizing most neighborhoods.
The relatively small number of neighborhoods at the lowest end is particularly notable. Although many American neighborhoods are characterized by some degree of land-use separation, most of the neighborhoods in this dataset still contain enough interaction between residential and employment functions to avoid the very lowest classifications. At the same time, reaching the highest classes appears comparatively uncommon because doing so requires a particularly strong relationship between residential and employment activity.
Employment/Household Mix also produces a somewhat clearer relationship with traditional mixed-use urban centers than Employment Mix alone. Downtown neighborhoods average approximately 14.92, substantially above the dataset-wide average of 10.51. Downtowns such as Portland, Maine; Shreveport; Eugene; Irving; Stockton; Baton Rouge; Dallas; Portland, Oregon; Los Angeles; San Diego; Houston; and San Angelo all receive relatively high scores. Nevertheless, the existence of high-scoring neighborhoods outside downtown areas demonstrates that employment-household balance can emerge in multiple forms of urban development.
The measure is especially useful when interpreted alongside the other National Walkability Index components. Intersection Density describes street-network connectivity; Proximity to Transit describes access to transit service; Employment Mix describes employment diversity; and Employment/Household Mix describes the relationship between employment and residential activity. Together, these measures capture different but complementary dimensions of the built environment.
San Angelo illustrates why this multidimensional approach is important. Downtown receives an Employment/Household Mix score of 15.00, indicating a relatively strong relationship between residential and employment activity, while Fort Concho scores 17.50 and the Bluffs 17.25. Yet these neighborhoods do not necessarily perform identically across Intersection Density, Employment Mix, or Proximity to Transit. Evaluating the individual components therefore reveals characteristics that would be obscured by examining only an overall walkability score.
Perhaps the most important geographic finding is that employment-household balance is fundamentally neighborhood-specific. Even within the same municipality, neighborhoods may range from predominantly residential areas to major employment centers to genuinely mixed-use districts. Consequently, municipal averages can conceal substantial differences in how jobs and households are distributed across urban space.
Taken together, the Employment/Household Mix results reinforce a central principle of neighborhood walkability: proximity between where people live and where economic activity occurs can contribute to a more accessible urban environment. When employment and residential uses coexist within neighborhoods, the potential exists for shorter trips and greater accessibility between daily activities. When this balance is combined with connected street networks, diverse employment opportunities, and effective transit access, neighborhoods possess a stronger foundation for supporting walking and reducing dependence on longer automobile trips.
Why It Matters
Employment and household mix is an important component of neighborhood walkability because it reflects how well places to live and places to work are integrated within a community. Neighborhoods that balance housing with employment opportunities allow residents to reach jobs, stores, schools, restaurants, parks, transit, and other daily destinations more conveniently, making walking and other forms of active transportation more practical. The EPA notes that people are increasingly choosing communities where they can walk from their homes to nearby amenities rather than drive for every trip (U.S. Environmental Protection Agency, 2021a).
A balanced employment-household mix contributes to walkability in several ways (U.S. Environmental Protection Agency, 2021a):
- Supports shorter trips. Locating homes and jobs closer together reduces the distance between everyday destinations, making walking, bicycling, and transit more feasible.
- Encourages active transportation. Walkable neighborhoods make it easier to reach stores, jobs, and services on foot, helping residents incorporate physical activity into their daily routines.
- Improves environmental outcomes. When more trips are made by walking, bicycling, or transit, communities experience reduced vehicle travel, lower air pollution, and improved environmental health.
- Creates more efficient development patterns. Compact, mixed-use neighborhoods conserve land and often require less roadway and utility infrastructure than dispersed development.
- Strengthens community life. Walkable environments encourage social interaction by creating opportunities for residents to encounter neighbors and participate in everyday community life.
The EPA’s Smart Location Database (SLD) identifies employment and housing diversity as one of five major domains used to evaluate location efficiency. Along with density, urban design, transit accessibility, and destination accessibility, employment-household mix helps describe how effectively a neighborhood supports travel choices beyond the automobile (U.S. Environmental Protection Agency, 2021b).
Within the Smart Location Database, the EPA measures employment-household relationships using several complementary indicators, including (U.S. Environmental Protection Agency, 2021b):
- Jobs per Household (D2a_JpHH) – the balance between the number of jobs and households within a Census Block Group.
- Employment and Household Entropy (D2a_EpHHm) – the degree to which employment and housing are evenly mixed.
- Employment and Household Entropy Based on Trip Production and Attraction (D2c_TrpMx1 and D2c_TrpMx2) – measures that evaluate how employment and housing balance influences potential trip-making patterns.
- Trip Production and Attraction Equilibrium Index (D2c_TripEq) – an indicator of how balanced trip production and attraction are within a neighborhood.
Rather than relying on a single measure, the EPA evaluates employment-household mix as part of a broader framework of density, diversity, design, transit accessibility, and destination accessibility. Together, these characteristics provide a more complete understanding of how the built environment influences travel behavior and neighborhood walkability (U.S. Environmental Protection Agency, 2021b, 2021a).
Employment Density vs. Employment Mix vs. Employment-Household Mix
These indicators describe different aspects of a neighborhood’s land-use pattern. Density measures quantity, while the two mix indicators measure how evenly different activities are represented.
Indicator | Main question | EPA variable | What it measures |
Employment density | How many jobs are concentrated here? | D1c | Jobs per acre of unprotected land |
Employment mix | How varied are the types of jobs here? | D2b_E8MixA in the National Walkability Index | Distribution of jobs among eight employment categories |
Employment-household mix | How evenly are homes and employment activities represented? | D2a_EpHHm | Distribution of occupied households and five employment categories |
Employment Density
Employment density measures the concentration of jobs within a Census block group. The EPA’s primary measure, D1c, divides total employment by the block group’s unprotected land area and reports the result as jobs per acre. The Smart Location Database also provides separate density measures for retail, office, industrial, service, entertainment, education, health-care, and public-administration employment (U.S. Environmental Protection Agency, 2021b).
A neighborhood can therefore have:
- High employment density but little housing, such as a major office district.
- Low employment density but a varied set of job types.
- High employment density and high employment-household mix when many jobs and homes are integrated.
Key point: Employment density measures the number and concentration of jobs, not their diversity or relationship to housing.
Employment Mix
Employment mix measures the variety and proportional balance of employment types within a block group. For the National Walkability Index, the EPA uses D2b_E8MixA, which divides jobs into eight categories:
- Retail
- Office
- Industrial
- Service
- Entertainment
- Education
- Health care
- Public administration
The measure applies an entropy calculation to determine how evenly jobs are distributed across all eight categories. A place dominated by one type of employment receives a lower value, while a place with jobs more evenly distributed among several categories receives a higher value (U.S. Environmental Protection Agency, 2021b).
Key point: Employment mix considers jobs only. It does not include households.
Employment-Household Mix
Employment-household mix measures the balance between residential activity and different types of employment. The EPA’s D2a_EpHHm variable includes:
- Occupied households
- Retail jobs
- Office jobs
- Industrial jobs
- Service jobs
- Entertainment jobs
Each category is calculated as a proportion of total activity, defined as total employment plus occupied households. An entropy formula then measures how evenly those activities are represented (U.S. Environmental Protection Agency, 2021b).
A block group dominated by housing or employment receives a relatively low score. A block group with a more even distribution of households and several employment categories receives a higher score.
Key point: Employment-household mix includes both homes and jobs, making it the most direct of the three indicators for describing whether residential and employment activities coexist.
Simple Comparison
Imagine three hypothetical neighborhoods:
Downtown office district
- 15,000 jobs
- Few residents
- Jobs primarily in offices
This area would likely have:
- High employment density
- Low employment mix
- Low employment-household mix
Industrial and commercial employment center
- Retail, industrial, service, and office jobs
- Few homes
- Moderate job concentration
This area could have:
- Moderate employment density
- High employment mix
- Low employment-household mix
Mixed-use town center
- Apartments and townhomes
- Retail, offices, restaurants, and services
- Jobs and households represented more evenly
This area could have:
- Moderate or high employment density
- High employment mix
- High employment-household mix
Important distinction
A high score for one indicator does not guarantee high scores for the others:
Employment density asks how many jobs are present. Employment mix asks how diverse those jobs are. Employment-household mix asks how evenly jobs and homes are represented together.
The National Walkability Index uses employment mix and employment-household mix as two separate proxies for land-use diversity. Each receives one-sixth of the final index weight, while intersection density and proximity to transit each receive one-third (U.S. Environmental Protection Agency, 2021a).
The EPA also cautions that these mix measures describe activity within block-group boundaries. They do not show whether uses are physically close together inside the block group or account for destinations immediately across its boundary (U.S. Environmental Protection Agency, 2021b).
Limitations
Although employment-household mix is a valuable indicator of walkability, it should be interpreted alongside other measures of the built environment. The EPA notes several important limitations of this metric (U.S. Environmental Protection Agency, 2021b).
Census Block Group Boundaries
The EPA calculates employment-household mix at the Census block group level. As a result, nearby destinations located just outside a block group’s boundary are not included in the calculation. A neighborhood may receive a relatively low score even though residents can easily walk to employment, shopping, or services located in an adjacent block group.
Spatial Arrangement Is Not Measured
The metric measures the balance of activities, but it does not evaluate where those activities are located within the block group. Housing and employment may both be present, yet separated by wide arterial roads, large parking lots, rail corridors, or other barriers that make walking difficult. Likewise, jobs and homes located close together may support walking more effectively than the metric alone suggests.
Quantity vs. Balance
Employment-household mix measures the proportional distribution of households and employment categories rather than the total number of jobs or residents. Two neighborhoods with very different numbers of households and jobs can receive similar scores if the proportions of each activity are comparable.
Does Not Measure Walking Infrastructure
A neighborhood may have a balanced mix of housing and employment but still be difficult to walk if sidewalks are missing, crossings are unsafe, or streets are designed primarily for high-speed automobile traffic. The employment-household mix metric does not evaluate pedestrian infrastructure, streetscape quality, or sidewalk conditions. These characteristics are captured by other measures—or may require field observation—and are not part of this specific indicator.
One Component of Walkability
The EPA emphasizes that employment-household mix is only one element of neighborhood walkability. The National Walkability Index combines employment-household mix with employment mix, street intersection density, and proximity to transit to provide a more comprehensive assessment of how supportive the built environment is for walking as a mode of transportation.
Key Takeaway
Employment-household mix provides valuable insight into how well homes and jobs are balanced within a neighborhood, but it does not measure every aspect of walkability. For the most complete understanding of a community’s pedestrian environment, this metric should be interpreted alongside indicators of employment diversity, residential and employment density, street connectivity, transit accessibility, and the quality of pedestrian infrastructure.
References
- Cervero, R., & Kockelman, K. (1997). Travel demand and the 3Ds: Density, diversity, and design. Transportation Research Part D: Transport and Environment, 2(3), 199–219. https://doi.org/10.1016/S1361-9209(97)00009-6
- Ewing, R., & Cervero, R. (2010). Travel and the Built Environment: A Meta-Analysis. Journal of the American Planning Association, 76(3), 265–294. https://doi.org/10.1080/01944361003766766
- Frank, L. D., Schmid, T. L., Sallis, J. F., Chapman, J., & Saelens, B. E. (2005). Linking objectively measured physical activity with objectively measured urban form. American Journal of Preventive Medicine, 28(2), 117–125. https://doi.org/10.1016/j.amepre.2004.11.001
- Henderson, S. (2025, February 11). From plan to place: Providence’s downtown renaissance [Text]. CNU. https://www.cnu.org/publicsquare/2025/02/11/plan-place-providences-downtown-renaissance
- S. Environmental Protection Agency. (2021a). National Walkability Index: Methodology and User Guide. U.S. Environmental Protection Agency (EPA). https://www.epa.gov/smartgrowth/smart-location-mapping#walkability
- S. Environmental Protection Agency. (2021b). Smart Location Database (SLD) 3.0: Technical Documentation and User Guide. U.S. Environmental Protection Agency. https://www.epa.gov/smartgrowth/smart-location-mapping#SLD