Neighborhood Intersection Density Across America
Explore how street connectivity varies across neighborhoods in dozens of U.S. cities. Intersection Density is one of the four variables used in the EPA National Walkability Index because connected street networks create shorter travel distances, greater route choice, and more walkable neighborhoods.
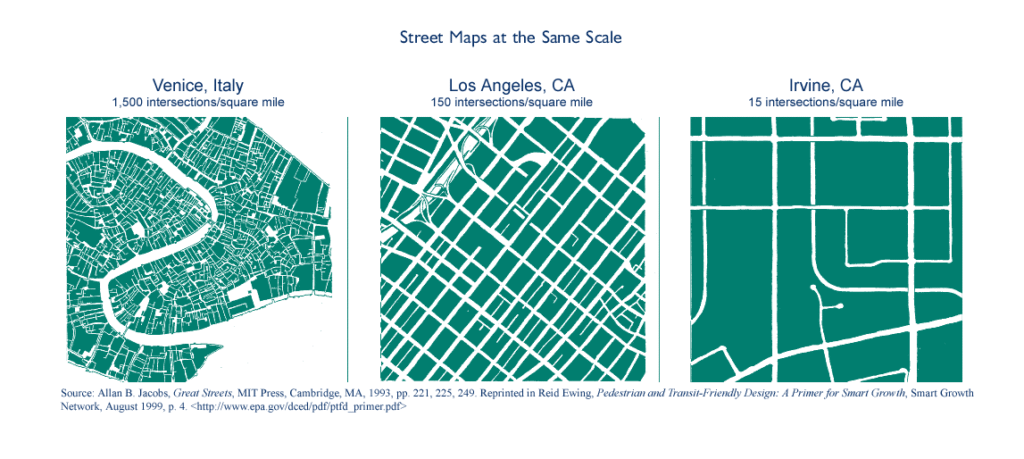
Street networks shown at the same scale demonstrate how intersection density affects connectivity. Dense, highly connected street patterns provide numerous route choices and support walking, while superblocks and cul-de-sacs limit connectivity and increase dependence on the automobile (Aurbach, 2010).
Quick Statistics
2,740
Neighborhoods Analyzed
14.65
Average Intersection Density
1–20
Observed Density Range
Other Variables of the National Walkability Index- Neighborhood Level
Neighborhood Walkability
Explore neighborhood-level walkability to identify local variations in accessibility, connectivity, and the built environment within municipalities.
Neighborhood Transit Accessibility
Evaluate neighborhood access to nearby transit stops and identify communities with stronger connections to public transportation.
Neighborhood Employment Mix
Analyze how employment opportunities are distributed within neighborhoods and how local land uses support walkability.
Neighborhood Jobs & Housing Mix
Measure the balance between employment and residential development within neighborhoods to better understand mixed-use environments.
Further Reading
Key Takeaways
- Neighborhood street connectivity varies considerably within municipalities. The dataset reveals that cities often contain both highly connected urban grids and disconnected suburban neighborhoods, demonstrating the importance of evaluating intersection density at the neighborhood level rather than relying solely on municipal averages.
- Historic urban neighborhoods consistently exhibit the highest intersection densities. Downtown districts, traditional street grids, university neighborhoods, and mixed-use commercial areas typically provide the greatest number of intersections and the shortest travel distances, supporting higher levels of pedestrian accessibility.
- Lower intersection density generally reflects suburban or specialized land uses. Airports, industrial districts, parks, reservoirs, and automobile-oriented suburban developments frequently have fewer intersections because of their intended land-use patterns rather than deficiencies in planning.
- Higher intersection density supports more efficient transportation networks. Research consistently shows that connected street networks reduce travel distances, increase route choice, improve transit accessibility, and encourage walking and bicycling while reducing automobile dependence (Cervero & Kockelman, 1997; Frank et al., 2005; Ewing & Cervero, 2010).
- Intersection density is a foundational measure of walkability but should be interpreted alongside other built environment characteristics. While connected streets create the framework for walkable neighborhoods, planners should also consider land-use diversity, transit access, pedestrian infrastructure, safety, and destination availability when evaluating overall neighborhood accessibility.
Neighborhoods-Distribution of EPA Intersection Density Scores
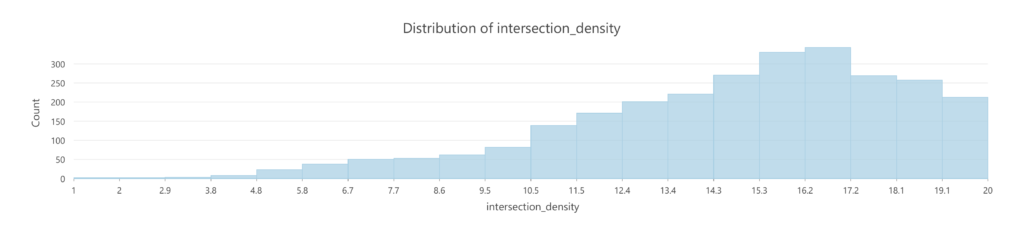
Distribution of EPA Intersection Density Scores for U.S. Neighborhoods:
- Sample size (2,740 Neighborhoods)
- Mean = 14.77
- Median = 15.36
- Min = 1
- Max = 20
- SD = 3.48
Neighborhood Intersection Density Analysis
Classification Categories
The American Walkability Atlas classifies neighborhoods into five intersection density categories to describe how connected neighborhood street networks are. Intersection density measures the concentration of street intersections within a neighborhood and serves as one of the four variables used by the EPA’s National Walkability Index. Higher intersection density generally reflects shorter blocks, multiple travel routes, and greater street connectivity, while lower intersection density often indicates larger blocks, cul-de-sacs, or more automobile-oriented development. Research has consistently identified street connectivity as one of the strongest predictors of walking, bicycling, and overall accessibility (Cervero & Kockelman, 1997; Frank et al., 2005; Ewing & Cervero, 2010).
- Very Low Intersection Density: Areas with very sparse street networks and relatively few qualifying intersections. These locations provide limited street connectivity and route choice and are associated with the lowest relative levels of intersection density.
- Low Intersection Density: Areas with relatively few intersections and limited street connectivity. The street network provides some route options, but connectivity remains comparatively low and may be less supportive of walking.
- Below Average Intersection Density: Areas with somewhat limited street connectivity and fewer intersections than more connected neighborhoods. These locations provide greater route choice than low-density networks but remain below the middle range of intersection density.
- Moderate Intersection Density: Areas with an intermediate level of street connectivity and intersection frequency. These street networks provide a moderate degree of route choice and represent the middle range between relatively disconnected and highly connected networks.
- Above Average Intersection Density: Areas with relatively well-connected street networks and more frequent intersections. Increased connectivity provides more route choices and creates built-environment conditions more supportive of walking.
- High Intersection Density: Areas with well-connected street networks characterized by frequent qualifying intersections and substantial route choice. These conditions are strongly supportive of walking relative to areas with lower intersection density.
- Very High Intersection Density: Areas with the greatest relative concentration of qualifying street intersections and highly connected street networks. Numerous route choices and high connectivity create conditions associated with the strongest relative support for walking.
Planning Implications
Intersection density is one of the most important measures of neighborhood connectivity because it directly influences how efficiently people can move through the built environment. Well-connected street networks provide shorter travel distances, greater route flexibility, and improved access to employment, schools, parks, transit, and commercial destinations. As a result, intersection density has become a widely used planning indicator for evaluating neighborhood accessibility, transportation efficiency, and walkability.
Research consistently demonstrates that neighborhoods with highly connected street networks encourage more walking and less automobile dependence. Cervero and Kockelman (1997) identified street design as one of the “3Ds” (Density, Diversity, and Design) that significantly influence travel behavior, while Frank et al. (2005) found that highly connected neighborhoods are associated with greater levels of walking and physical activity. Similarly, Ewing and Cervero (2010) concluded through a meta-analysis that street connectivity is one of the strongest built environment variables affecting travel patterns.
Neighborhoods with High and Very High Intersection Density generally require planning strategies that preserve existing connectivity while improving pedestrian safety through traffic calming, crosswalk enhancements, bicycle infrastructure, and complete street investments. Conversely, neighborhoods with Very Low or Low Intersection Density may benefit from long-term strategies that improve connectivity through new street connections, pedestrian pathways, trail systems, and redevelopment projects that reduce superblocks or isolated street patterns.
However, planners should recognize that not every low-density street network represents a planning deficiency. Airports, industrial facilities, reservoirs, military installations, and large parks often exhibit low intersection density because their land uses require limited public street access. Consequently, intersection density should always be interpreted within the context of surrounding land uses and local planning objectives.
Understanding Neighborhood Walkability
Street connectivity forms the physical framework that supports neighborhood walkability. At the neighborhood scale, intersection density measures how easily residents can move from one location to another using the local street network. Unlike municipal averages, neighborhood-level analysis reveals substantial differences in connectivity that often exist within the same city.
Neighborhoods with higher intersection density typically provide:
- More direct walking routes.
- Greater route choice for pedestrians and cyclists.
- Shorter block lengths.
- Improved access to destinations and transit.
- Better overall transportation network resilience.
These characteristics reduce travel distances while improving accessibility for multiple transportation modes. Traditional grid street networks often outperform suburban street systems because they provide numerous interconnected routes rather than relying on collector roads and cul-de-sacs.
Although intersection density is an essential component of walkability, it should not be interpreted in isolation. A neighborhood with a highly connected street network may still have poor pedestrian conditions if sidewalks are incomplete, traffic volumes are excessive, or destinations are lacking. Likewise, neighborhoods with lower intersection density may still provide pleasant walking environments when supported by trails, parks, or other pedestrian facilities. Therefore, intersection density should be evaluated alongside land-use diversity, transit accessibility, sidewalk infrastructure, pedestrian safety, and destination availability to develop a comprehensive understanding of neighborhood walkability.
Geographic Patterns in Neighborhood Walkability
The neighborhood-level intersection-density results reveal a strong geographic relationship between street-network form and urban development pattern. Across the 2,740 neighborhoods analyzed, the average intersection-density score is approximately 14.77, with a median of 15.36. Scores range from 1.00 to 20.00, indicating substantial variation in street connectivity across the study area.
Using the same seven fixed intervals applied elsewhere in the analysis, the distribution is strongly concentrated toward the upper-middle portion of the scale. Only 4 neighborhoods (0.1%) fall between 0–2.86, 34 (1.2%) between 2.86–5.71, and 140 (5.1%) between 5.71–8.57. By comparison, 284 neighborhoods (10.4%) fall between 8.57–11.43, 592 (21.6%) between 11.43–14.29, 945 (34.5%) between 14.29–17.14, and 741 (27.0%) between 17.14–20.00. In other words, more than 61 percent of neighborhoods fall within the two highest analytical ranges, suggesting that relatively connected street networks are common within the cities represented in the dataset.
This pattern is directly relevant to the EPA National Walkability Index methodology. EPA identifies intersection density, represented by Smart Location Database variable D3b, as one of the principal built-environment characteristics associated with walking. Higher intersection density is correlated with more walk trips because a denser network of intersections generally provides more route choices and more direct connections between origins and destinations. Intersection density is one of four ranked measures used to calculate the National Walkability Index, alongside transit proximity, employment mix, and employment-and-household mix.
The highest intersection-density scores are frequently found in traditional urban neighborhoods, historic districts, compact residential areas, downtowns, and mixed-use districts characterized by interconnected street grids. Numerous neighborhoods achieve the maximum score of 20.00, including Portland’s Old Town–Pearl District, Portland Downtown, King, and Sunnyside; Dallas’ Victory Park; Spokane’s Emerson/Garfield; San Diego’s Mission Beach; and several Long Beach neighborhoods such as East Village, Bluff Heights, Bluff Park, Naples, Belmont Park, and Peninsula. These results are consistent with the physical structure of neighborhoods developed around relatively fine-grained street networks with frequent intersections.
Downtown areas also generally perform strongly. Among the 52 neighborhoods containing “Downtown” in their names, the mean intersection-density score is approximately 16.80, more than two points above the dataset-wide mean. Examples include Portland Downtown (20.00), San Angelo Downtown (18.00), Irving Downtown (17.00), San Diego Downtown (16.93), Miami Downtown (16.47), Los Angeles Downtown (16.39), Riverside Downtown (15.73), Stockton Downtown (15.50), and Urban Honolulu Downtown (15.30). This reinforces the general pattern that central urban districts tend to retain relatively connected street networks.
However, the data also demonstrate that a downtown designation does not automatically imply maximum intersection density. Waco Downtown, for example, scores 13.75, Baton Rouge Downtown 13.67, Houston Downtown 14.40, and Shreveport Downtown Riverfront 13.00. Differences such as these may reflect larger blocks, highway infrastructure, superblocks, rail corridors, civic complexes, waterways, or other physical interruptions to the street network. Thus, intersection density measures the structural connectivity of the network rather than simply whether a neighborhood is centrally located.
A broad center-to-edge pattern is also evident in many cities. Older central neighborhoods commonly exhibit higher scores because traditional street systems were often constructed as closely spaced grids with numerous intersections. In contrast, peripheral residential areas, large-lot neighborhoods, environmentally constrained areas, and newer suburban developments frequently show lower scores. Dallas illustrates this contrast particularly well: the Central Business District scores 19.50, Oak Lawn 17.15, and Uptown 17.75, while Far Northwest Dallas scores 7.00 and the Kleberg-Rylie Area 8.71.
San Angelo displays a comparable pattern. Downtown and Central both score 18.00, Santa Rita scores 18.33, Reagan 17.75, and Angelo Heights 16.00. In contrast, Nasworthy scores 5.50, Country Club 6.00, Riverside 6.50, Glenmore 8.33, and Goodfellow Air Force Base 9.00. This illustrates how differences in street-network design can occur within the same municipality and reinforces the value of examining neighborhood-scale patterns rather than citywide averages.
The lowest-scoring areas are frequently associated with water bodies, parks, undeveloped land, industrial areas, military facilities, peripheral development, and other specialized land uses where traditional street grids are either unnecessary or physically impractical. Examples include New Orleans’ Lake Catherine (1.00), Stockton’s Mariposa Lakes (2.00), New Orleans’ Viavant–Venetian Isles (3.50), Los Angeles’ Chatsworth Reservoir (4.00), San Diego’s San Pasqual (4.00), and Portland’s Forest Park–Linnton area (5.25).
These low scores should therefore not automatically be interpreted as evidence of deficient planning. Intersection density reflects the configuration and connectivity of the street network, and some land uses are not intended to support dense networks of local streets. Reservoirs, parks, military installations, airports, industrial districts, and protected open spaces can reasonably have low intersection densities because their land-use functions differ substantially from residential or commercial neighborhoods.
Overall Pattern
Overall, intersection density exhibits an even stronger concentration toward the upper end of the scale than the composite National Walkability Index. Approximately 61.5 percent of all neighborhoods score above 14.29, while only about 6.5 percent score below 8.57. The largest single group consists of the 945 neighborhoods between 14.29 and 17.14, followed by the 741 neighborhoods between 17.14 and 20.00. This indicates that the cities included in the analysis contain many neighborhoods with moderately to highly connected street networks, even when their overall walkability may be lower because of weak transit accessibility or limited land-use diversity.
That distinction is important. Intersection density represents only one component of walkability, not walkability itself. EPA’s methodology assigns intersection density one-third of the total conceptual weighting of the National Walkability Index, with another one-third assigned to transit proximity and the remaining one-third divided between the two land-use-mix measures. Consequently, a neighborhood can possess a highly connected street network but still receive a moderate overall NWI score if it lacks nearby transit or a diverse mixture of employment and residential uses.
The EPA’s suburban example demonstrates this interaction particularly well. Its intersection-density rank is 11, while transit proximity receives a rank of only 1; despite relatively strong employment-mix scores, the lack of transit access contributes to a below-average overall walkability result. Conversely, EPA’s city-center example receives an intersection-density rank of 19 and a transit-proximity rank of 19, allowing multiple supportive built-environment characteristics to reinforce one another and generate a much higher NWI score.
The neighborhood data further suggest that street connectivity often reflects the historical evolution of urban form. Traditional neighborhoods developed around gridded or semi-gridded street systems tend to contain many intersections and alternative routes. Later suburban environments are more likely to incorporate hierarchical street systems, loops, cul-de-sacs, large superblocks, and limited connections between adjoining subdivisions. These physical differences help explain why older central neighborhoods frequently appear in the upper classes while peripheral and specialized areas appear more often in the lower classes.
At the same time, the dataset demonstrates that the relationship is not perfectly synonymous with downtown proximity. Numerous residential neighborhoods outside downtown cores achieve extremely high scores. Portland, Long Beach, New Orleans, Spokane, and other cities contain extensive networks of older residential neighborhoods with intersection-density values approaching or reaching 20.00. This indicates that high connectivity can extend well beyond a central business district where the underlying street grid remains intact.
Perhaps the most important conclusion is that intersection density is fundamentally a neighborhood-scale characteristic. Large differences can occur over relatively short distances because street-network form changes from one neighborhood to another. A municipality may contain a gridded historic core, connected streetcar-era neighborhoods, curvilinear postwar suburbs, industrial superblocks, campuses, parks, and undeveloped peripheral areas simultaneously. A single municipal average would obscure these differences.
Taken together, the results strongly support the role assigned to street connectivity within the EPA framework. EPA explicitly identifies higher intersection density as being associated with greater levels of walking and incorporates D3b into the National Walkability Index as a core measure of urban design. Your neighborhood-level analysis expands that framework spatially by showing where connected networks are concentrated and where physical barriers, specialized land uses, or suburban development patterns reduce connectivity. When interpreted alongside transit accessibility and land-use diversity, intersection density therefore provides a valuable explanation for why walkability varies so substantially both between cities and among neighborhoods within the same city.
WHY intersections matter
The EPA introduction provides much richer reasoning than your current explanation.
It notes that walkable communities
- encourage physical activity,
- reduce obesity and diabetes,
- reduce vehicle emissions,
- conserve land and infrastructure,
- improve social interaction,
- improve pedestrian safety through slower vehicle speeds and shorter crossings (U.S. Environmental Protection Agency, 2021a).
Greater intersection density supports a street network that encourages walking, improves access to destinations, shortens travel distances, reduces dependence on automobiles, and contributes to healthier, safer, and more socially connected neighborhoods (U.S. Environmental Protection Agency, 2021a).
Difference between 3-way and 4-way Intersections
The EPA specifically distinguishes
- three-leg intersections
- four-plus-leg intersections
- pedestrian-oriented intersections
- auto-oriented intersections
within its database (U.S. Environmental Protection Agency, 2021b).
Typical contribution to street connectivity. Actual walkability also depends on traffic speed, crossing distance, sidewalks, land uses, transit access, and the design of the surrounding streets.
Street-network form | Typical contribution to connectivity |
Cul-de-sac | Very limited |
Three-way intersection | Moderate |
Four-way intersection | Strong |
Connected grid network | Very strong |
These categories describe typical contributions to network connectivity, not overall pedestrian safety or walkability. Street width, traffic speed, sidewalks, crossing design, destinations, and surrounding land uses also affect walking conditions.
EPA Design Metric (D3)
The EPA classifies intersection density as one component of the Design (D3) category within the Smart Location Database.
The Design category measures:
- Road network density
- Street intersection density
- Auto-oriented intersections
- Multi-modal intersections
- Pedestrian-oriented intersections
Intersection density is only one part of evaluating neighborhood connectivity (U.S. Environmental Protection Agency, 2021b).
Limitations
Although intersection density is one of the strongest indicators of street connectivity, it should be interpreted alongside other characteristics of the built environment. The EPA identifies several important limitations of this metric (U.S. Environmental Protection Agency, 2021b).
Street Connectivity Does Not Measure Sidewalk Quality
Intersection density measures how connected the street network is, but it does not indicate whether sidewalks, crosswalks, curb ramps, lighting, shade, or other pedestrian facilities are present or in good condition. A neighborhood may have a dense network of intersections yet still provide an uncomfortable or unsafe walking environment if pedestrian infrastructure is lacking. The EPA notes that the source street network includes pedestrian pathways where available but does not contain information on the presence or quality of sidewalks.
Not All Intersections Contribute Equally to Walkability
The EPA recognizes that different intersection types affect pedestrian movement differently. To better reflect walkability, the Smart Location Database assigns greater weight to intersections that support pedestrian and bicycle travel while reducing the influence of automobile-oriented intersections such as freeway interchanges and ramps. Consequently, the metric represents weighted street connectivity rather than a simple count of all intersections.
Connectivity Does Not Reflect Land Use
A highly connected street network does not necessarily mean destinations are nearby. A neighborhood may contain many intersections but few homes, jobs, shops, schools, parks, or transit stops within walking distance. For this reason, the EPA combines intersection density with measures of employment and household mix, employment diversity, and transit accessibility when calculating the National Walkability Index.
Geographic Constraints Can Influence Street Networks
Street layouts are often shaped by physical features such as rivers, lakes, steep terrain, rail corridors, or other barriers. These conditions may naturally reduce intersection density even when neighborhoods remain reasonably walkable through bridges, trails, or other transportation facilities. Therefore, lower intersection density does not always indicate poor urban design.
Note: This limitation is a planning interpretation consistent with how transportation networks function but is not explicitly discussed in the EPA documents.
One Component of Walkability
The EPA emphasizes that intersection density is only one component of neighborhood walkability. The National Walkability Index combines weighted intersection density with three additional measures:
- Employment and household mix
- Employment mix
- Proximity to transit
Together, these indicators provide a more comprehensive assessment of whether the built environment supports walking as a mode of transportation than any single measure alone.
Key Takeaway
Intersection density is an effective indicator of street network connectivity and route choice, but it does not measure every aspect of the pedestrian environment. For the most complete understanding of neighborhood walkability, it should be interpreted alongside indicators of land-use diversity, transit accessibility, destination accessibility, residential and employment density, and pedestrian infrastructure quality.
Limitations of Neighborhood-Level Intersection Density: The Manhattan Case Study
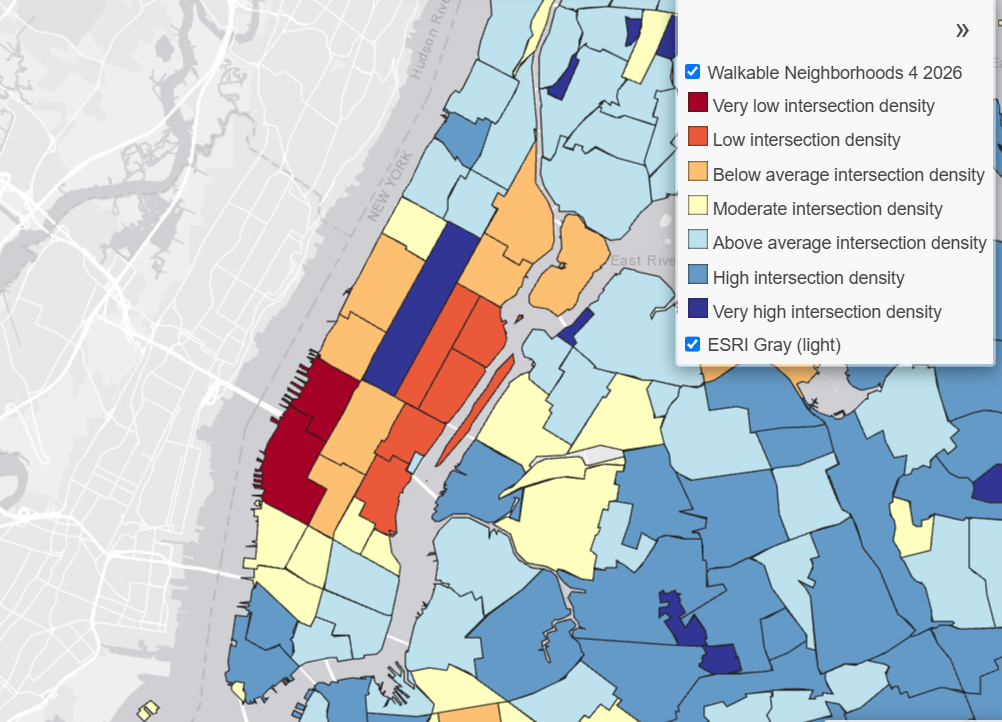
When evaluated alongside other U.S. municipalities, New York City receives a relatively modest National Walkability Index (NWI) score and is classified only as above average in walkability. This result appears to be driven primarily by comparatively low intersection density scores, particularly within Manhattan. At face value, this finding is counterintuitive, as Manhattan is widely recognized as one of the most walkable urban environments in the United States. The apparent discrepancy is likely attributable, at least in part, to the methodology used to calculate the National Walkability Index. The EPA computes the Index at the Census block group level using four built-environment measures: street intersection density, proximity to transit stops, employment mix, and employment–household mix. These variables are ranked nationally and combined to produce the final NWI score (U.S. Environmental Protection Agency, 2021a).
Neighborhood-level analysis indicates that many Census block groups in Midtown and Upper Manhattan are exceptionally small, with numerous block groups encompassing only a single city block. In many cases, street intersections occur along the boundaries of adjacent block groups rather than within the interior of the block group itself. Because the National Walkability Index evaluates weighted street intersection density for individual Census block groups rather than the surrounding street network, these unusually small geographic units may receive comparatively low intersection density values despite being embedded within one of the most connected street grids in the United States. The EPA also notes that block groups in dense urban areas may be as small as one or two acres, making this type of boundary effect more likely in places such as Manhattan (U.S. Environmental Protection Agency, 2021a, 2021b). While Lower Manhattan appears less affected by this pattern, the prevalence of very small block groups throughout Midtown and Upper Manhattan likely suppresses intersection density scores and, consequently, lowers the city’s overall NWI score.
Several additional characteristics of Midtown Manhattan may further contribute to these lower intersection density values. Large institutional, commercial, transportation, and open-space uses—including office complexes, rail terminals, hospital campuses, and parks—often occupy entire city blocks or multiple blocks while contributing relatively few street intersections. Furthermore, the Smart Location Database calculates a weighted measure of street intersection density and derives this metric from the HERE NAVSTREETS road network (U.S. Environmental Protection Agency, 2021b). Consequently, pedestrian connections that extend beyond the conventional street network, such as subway concourses, pedestrian plazas, and other grade-separated pedestrian facilities, are unlikely to be fully represented by the intersection density metric. Although these features substantially enhance the pedestrian experience, they are not explicitly incorporated into the NWI’s measure of street connectivity. Collectively, these methodological characteristics suggest that the National Walkability Index may systematically underestimate walkability in portions of Midtown Manhattan.
Although employment mix and employment–household mix scores also appear to be relatively low for New York City, a comprehensive assessment of these variables remains in progress. At the time of writing, detailed analysis has been completed only for Staten Island and Manhattan. Further evaluation of the remaining boroughs is expected to provide additional insight into the factors influencing these components of the National Walkability Index.
These findings illustrate an important limitation of applying a nationally standardized, block group–based walkability metric to extremely dense urban environments. While the National Walkability Index provides a consistent framework for comparing communities across the United States, it may not fully capture the pedestrian connectivity and urban form characteristic of places such as Midtown Manhattan.
References
- Aurbach, L. (2010, May 27). The Power of Intersection Density | Ped Shed. https://pedshed.net/?p=574
- Cervero, R., & Kockelman, K. (1997). Travel demand and the 3Ds: Density, diversity, and design. Transportation Research Part D: Transport and Environment, 2(3), 199–219. https://doi.org/10.1016/S1361-9209(97)00009-6
- Ewing, R., & Cervero, R. (2010). Travel and the Built Environment: A Meta-Analysis. Journal of the American Planning Association, 76(3), 265–294. https://doi.org/10.1080/01944361003766766
- Frank, L. D., Schmid, T. L., Sallis, J. F., Chapman, J., & Saelens, B. E. (2005). Linking objectively measured physical activity with objectively measured urban form. American Journal of Preventive Medicine, 28(2), 117–125. https://doi.org/10.1016/j.amepre.2004.11.001
- S. Environmental Protection Agency. (2021a). National Walkability Index: Methodology and User Guide. U.S. Environmental Protection Agency (EPA). https://www.epa.gov/smartgrowth/smart-location-mapping#walkability
- S. Environmental Protection Agency. (2021b). Smart Location Database (SLD) 3.0: Technical Documentation and User Guide. U.S. Environmental Protection Agency. https://www.epa.gov/smartgrowth/smart-location-mapping#SLD