Neighborhood Employment Mix Across America
Explore how employment diversity varies across neighborhoods in dozens of U.S. cities. Employment Mix is one of the four variables used in the EPA National Walkability Index because neighborhoods with a greater diversity of nearby employment opportunities often support shorter trips, increased transportation choice, and more walkable communities.
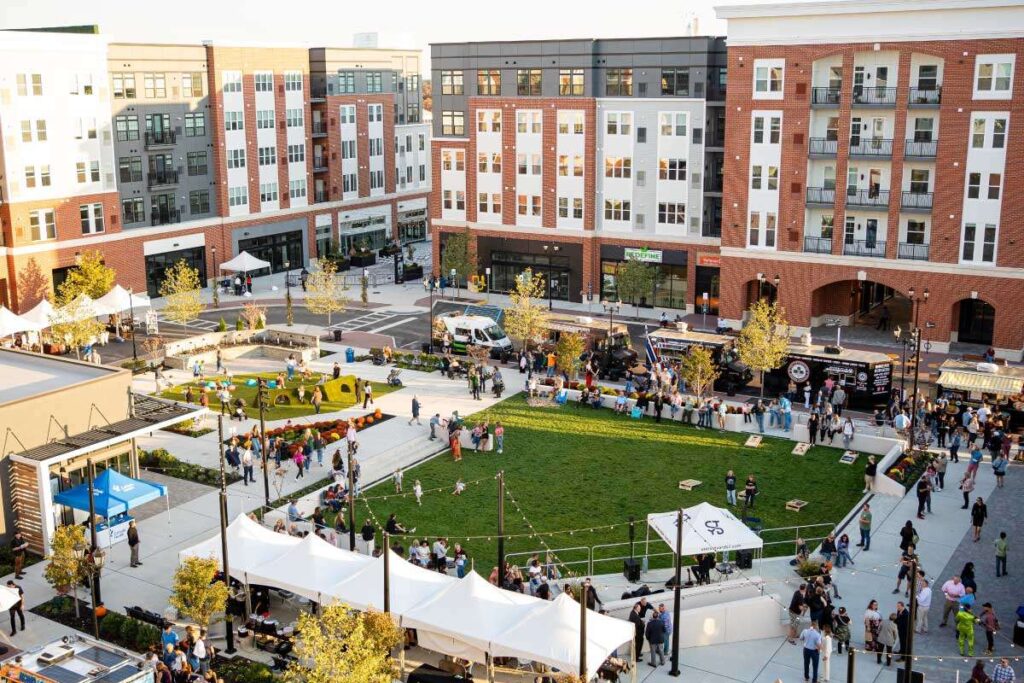
Station Yards is a mixed-use, transit-oriented redevelopment project aimed at reshaping Ronkonkoma, New York, into a vibrant, walkable community. The development integrates residential, commercial, and public spaces around the Long Island Rail Road station, allowing residents and visitors to live, work, shop, dine, and gather within a compact, pedestrian-friendly environment. By concentrating diverse land uses around transit, Station Yards demonstrates how mixed-use development can reduce automobile dependence while fostering economic development and community life. Photo courtesy of Propmodo (2025).
Quick Statistics
2,740
Neighborhoods Analyzed
10.27
Average Employment Mix Score
1-20
Observed Employment Mix Range
Other Variables of the National Walkability Index- Neighborhood Level
Neighborhood Walkability
Explore neighborhood-level walkability to identify local variations in accessibility, connectivity, and the built environment within municipalities.
Neighborhood Intersection Density
Compare street connectivity across neighborhoods to identify highly connected areas that support safer and more direct pedestrian travel.
Neighborhood Transit Accessibility
Evaluate neighborhood access to nearby transit stops and identify communities with stronger connections to public transportation.
Neighborhood Jobs & Housing Mix
Measure the balance between employment and residential development within neighborhoods to better understand mixed-use environments.
Further Reading
Key Takeaways
- Employment Mix measures economic diversity rather than total employment. Neighborhoods receive higher scores when jobs are distributed across multiple sectors, creating a wider variety of destinations within walking distance.
- The highest Employment Mix scores are concentrated in mixed-use activity centers. Downtowns, university districts, medical centers, commercial corridors, and historic business districts consistently provide the greatest diversity of employment opportunities.
- Specialized land uses frequently receive lower scores. Airports, industrial districts, parks, reservoirs, military facilities, and predominantly residential neighborhoods often exhibit lower Employment Mix because they contain fewer employment sectors rather than fewer jobs overall.
- Greater employment diversity supports walkability and transportation choice. Planning research consistently finds that neighborhoods with diverse land uses encourage walking, shorten trip distances, and reduce automobile dependence (Cervero & Kockelman, 1997; Frank et al., 2005; Ewing & Cervero, 2010).
- Employment Mix is one component of neighborhood accessibility. While diverse employment opportunities increase the number of walkable destinations, planners should evaluate this variable alongside intersection density, transit accessibility, and the balance between employment and housing to gain a complete understanding of neighborhood walkability.
Neighborhoods-Distribution of EPA Employment Mix Scores
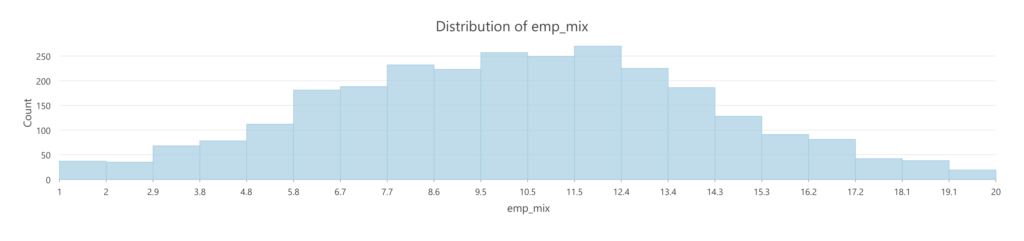
Distribution of EPA Employment Mix Scores for U.S. Neighborhoods:
- Sample size (2,740 Neighborhoods)
- Mean = 10.27
- Median = 10.32
- Min = 1
- Max = 20
- SD = 3.86
Neighborhood Employment Mix Analysis
Classification Categories
The American Walkability Atlas classifies neighborhoods into five categories based on their Employment Mix scores. This variable measures the diversity of employment opportunities within a neighborhood by evaluating how evenly jobs are distributed across different economic sectors. Rather than simply measuring the number of jobs, Employment Mix reflects the variety of employment types available, including retail, office, service, industrial, institutional, entertainment, and other economic activities. Within the EPA’s National Walkability Index, neighborhoods with a greater diversity of employment opportunities generally provide more destinations that support walking throughout the day.
Research consistently demonstrates that neighborhoods containing a diverse mix of employment types generate more walking, shorter trip distances, and greater transportation choice because residents and visitors have access to a wider variety of destinations (Cervero & Kockelman, 1997; Frank et al., 2005; Ewing & Cervero, 2010).
- Very Low Employment Mix: Areas where employment is highly concentrated in a limited number of employment categories or where the distribution of employment across categories is very uneven. These locations represent the lowest relative level of employment diversity.
- Low Employment Mix: Areas with limited diversity among employment categories. Multiple types of employment may be present, but one or a small number of categories remain dominant.
- Below Average Employment Mix: Areas with some diversity in employment activity, but the distribution of jobs across employment categories remains less balanced than in more mixed areas.
- Moderate Employment Mix: Areas with an intermediate degree of employment diversity. Jobs are distributed across several employment categories with a moderate level of balance among them.
- Above Average Employment Mix: Areas with relatively diverse employment activity and a more balanced distribution of jobs across employment categories. These conditions provide a stronger mix of employment uses than the middle range.
- High Employment Mix: Areas with a broad and relatively balanced distribution of employment across multiple categories. This high level of employment diversity is associated with built-environment conditions that are more supportive of walking.
- Very High Employment Mix: Areas with the greatest relative diversity and balance among employment categories. These locations represent the highest level of employment mix measured by this component of the National Walkability Index.
Planning Implications
Employment diversity is a fundamental characteristic of walkable neighborhoods because it creates destinations that generate trips throughout the day. While residential density determines where people live, employment diversity influences where people work, shop, dine, receive healthcare, access services, and participate in recreational activities. The EPA includes Employment Mix within the National Walkability Index because neighborhoods containing multiple employment sectors typically support more frequent walking and shorter trip distances.
Research has consistently shown that mixed employment environments encourage active transportation by increasing the number and variety of nearby destinations. Cervero and Kockelman (1997) identified land-use diversity as one of the “3 Ds” influencing travel behavior, while Frank et al. (2005) demonstrated that diverse land-use patterns are associated with increased walking and improved public health outcomes. Likewise, Ewing and Cervero (2010) concluded that land-use diversity significantly influences travel behavior by encouraging shorter trips and reducing automobile dependence.
Neighborhoods with High and Very High Employment Mix often benefit from planning policies that preserve mixed-use zoning, encourage adaptive reuse of commercial properties, support small businesses, and maintain pedestrian-oriented commercial districts. Investments in streetscapes, transit access, bicycle infrastructure, and public spaces can further strengthen these neighborhoods by improving connections among diverse employment destinations.
Neighborhoods with Low or Very Low Employment Mix may benefit from strategic infill development, neighborhood commercial centers, mixed-use redevelopment, and zoning reforms that gradually introduce additional employment opportunities while preserving neighborhood character. However, planners should recognize that some neighborhoods intentionally contain specialized land uses—such as airports, industrial parks, military installations, or large recreational areas—where limited employment diversity reflects their intended function rather than a planning deficiency.
Ultimately, Employment Mix should be evaluated alongside residential density, street connectivity, transit accessibility, and the balance between employment and housing to understand how neighborhoods support complete, walkable communities.
Understanding Neighborhood Walkability
Employment Mix contributes to neighborhood walkability by increasing the variety of destinations that residents and visitors can reach within a reasonable walking distance. A neighborhood containing offices, restaurants, healthcare facilities, retail stores, schools, entertainment venues, and public services offers more opportunities for people to accomplish multiple daily activities without relying exclusively on an automobile.
Unlike municipal averages, neighborhood-level Employment Mix captures localized differences in economic activity within the same city. One neighborhood may function primarily as a residential community with few employment destinations, while another may serve as a regional commercial center with offices, restaurants, retail businesses, educational institutions, and entertainment venues located within a compact area.
High Employment Mix generally supports:
- Greater diversity of walkable destinations.
- Increased opportunities for walking throughout the day.
- Stronger local economies.
- Reduced automobile dependence.
- More resilient neighborhood business districts.
Employment Mix alone, however, does not determine neighborhood walkability. A neighborhood may contain numerous employment sectors but still experience poor pedestrian conditions because of wide arterial roads, disconnected street networks, limited sidewalks, or inadequate transit access. Likewise, primarily residential neighborhoods can still provide excellent walking environments when they feature connected street networks, nearby parks, schools, neighborhood commercial areas, and safe pedestrian infrastructure. Consequently, Employment Mix should be interpreted alongside the other components of the National Walkability Index.
Geographic Patterns in Neighborhood Walkability
The neighborhood-level Employment Mix results reveal a substantially different distribution from both Intersection Density and Proximity to Transit. Across all 2,740 neighborhoods, the average employment-mix score is approximately 10.27, with a median of approximately 10.32. Scores range from 1.00 to 20.00, demonstrating considerable variation in the degree to which different employment types are represented within neighborhoods. The dataset itself identifies this measure as emp_mix, with individual neighborhood values ranging widely even within the same municipality.
Using the same seven fixed intervals with an interval size of approximately 2.857143, the distribution is concentrated primarily in the middle classes. 72 neighborhoods (2.6%) fall between 0–2.86, 255 (9.3%) between 2.86–5.71, 598 (21.8%) between 5.71–8.57, 732 (26.7%) between 8.57–11.43, 684 (25.0%) between 11.43–14.29, 300 (10.9%) between 14.29–17.14, and 99 (3.6%) between 17.14–20.00. Approximately 73.5 percent of all neighborhoods therefore fall between 5.71 and 14.29, indicating that moderate employment diversity is considerably more common than either extremely low or extremely high employment mix.
This pattern is consistent with the EPA National Walkability Index methodology. Employment mix is intended to capture the diversity of employment types within a Census block group, rather than simply the total number of jobs. The EPA methodology recognizes that a greater mixture of employment types can increase the variety of destinations available within an area and therefore contribute to an environment more supportive of walking. Employment mix operates alongside intersection density, proximity to transit, and employment-and-household mix in the overall National Walkability Index.
Unlike Intersection Density, however, Employment Mix does not display as straightforward a center-to-edge geographic pattern. Downtowns generally perform better than the dataset as a whole, but high employment-mix scores also occur in suburban employment centers, commercial districts, industrial-commercial areas, and other specialized locations. Among the 52 neighborhoods containing “Downtown” in their names, the average Employment Mix score is approximately 13.96, substantially higher than the overall neighborhood average of 10.27. Nevertheless, individual downtown scores vary considerably.
For example, Stockton Downtown scores 17.75, San Angelo Downtown 17.00, Portland Downtown approximately 16.22, Dallas’ Central Business District 14.83, Bellevue Downtown 14.80, Houston Downtown 14.00, Los Angeles Downtown approximately 13.83, San Diego Downtown approximately 13.36, Riverside Downtown approximately 12.09, Waco Downtown 10.25, Miami Downtown approximately 9.29, and Long Beach Downtown 9.80. These differences demonstrate that central location alone does not guarantee a highly diverse employment structure. A downtown dominated by a limited number of employment sectors can score lower than a neighborhood containing a more balanced range of employment activities.
The results also show that some of the highest Employment Mix scores occur outside traditional downtowns. Irvine’s Cypress Village receives the maximum score of 20.00, while Spectrum Center–Spectrum 4 & 6 scores 19.00, Orchard Hills 19.00, and Lower Peters Canyon 18.00. Similarly, Dallas’ Cedars scores 20.00, Deep Ellum 19.00, and the Design District 19.00, compared with 14.83 for the Central Business District. These examples reinforce the idea that Employment Mix measures the composition of economic activity rather than simply urban density or proximity to a city center.
San Angelo provides a particularly useful example of substantial within-city variation. Downtown scores 17.00, Fort Concho 18.00, the Bluffs 16.75, Southland 16.50, Santa Rita approximately 15.83, and Country Club 15.00. At the other end, Sunset scores 1.00, Angelo Heights 3.00, Belaire 5.00, Fort Concho East 6.80, and Glenmore 7.00. This variation is especially notable because all San Angelo neighborhoods received the minimum score for Proximity to Transit. Employment Mix therefore provides differentiation that the transit variable could not capture within the city.
Waco displays a similarly varied pattern. Austin Avenue scores 17.50, Richland Hills approximately 17.33, Heart of Texas 14.50, Lake Waco 13.40, and Kendrick approximately 13.33. By contrast, Dean Highland scores 3.20, Timbercrest approximately 3.67, Airport approximately 4.33, Carver 4.60, and Landon Branch 5.60. Downtown’s score of 10.25 falls close to the dataset-wide mean. This again illustrates that the geography of employment diversity is considerably more complex than a simple assumption that downtown neighborhoods necessarily contain the greatest employment mix.
Los Angeles further demonstrates this complexity. The city’s Downtown neighborhood scores approximately 13.83, while neighborhoods such as Pico-Robertson (15.85), Pacific Palisades (15.81), Playa Vista (15.67), West Los Angeles (15.60), Sawtelle (15.54), and Carthay (16.00) perform as well as or better than Downtown. At the opposite extreme, Chatsworth Reservoir scores 1.00, Watts 3.44, Hansen Dam 5.00, Green Meadows approximately 5.26, and Vermont Vista 5.70.
These patterns illustrate an important characteristic of Employment Mix: high scores can emerge in several different urban contexts. A traditional downtown may contain a diverse collection of offices, retail establishments, restaurants, institutions, and services, but similar diversity can also occur within suburban commercial centers, mixed employment districts, medical or institutional areas, and redevelopment districts. Consequently, Employment Mix does not correspond as directly to a particular street-network pattern or distance from downtown as Intersection Density often does.
The lowest Employment Mix values should likewise be interpreted carefully. A low score does not necessarily mean that a neighborhood has little employment overall. Rather, it can indicate that employment is concentrated within a narrower range of employment types. Specialized industrial districts, institutional campuses, primarily residential neighborhoods, parks, and other single-purpose areas may therefore receive relatively low scores because their economic or land-use functions are less diverse.
Overall Pattern
Overall, Employment Mix displays a distinctly middle-heavy distribution. The largest class is 8.57–11.43, containing 732 neighborhoods (26.7%), followed closely by 11.43–14.29 with 684 neighborhoods (25.0%) and 5.71–8.57 with 598 neighborhoods (21.8%). Together, these three middle classes contain 2,014 of the 2,740 neighborhoods, or approximately 73.5 percent of the entire dataset.
The extremes are comparatively uncommon. Only 72 neighborhoods (2.6%) occupy the lowest class, while only 99 neighborhoods (3.6%) occupy the highest. This differs considerably from Proximity to Transit, where neighborhoods were strongly concentrated toward the upper end while a substantial group also occupied the lowest class. Employment Mix instead resembles a more gradual continuum in which moderate values dominate.
This distribution makes conceptual sense because achieving an extremely high employment-mix score requires a neighborhood to contain a particularly diverse economic structure. Many neighborhoods naturally specialize to some extent. Predominantly residential neighborhoods may contain relatively few employment categories, while industrial, institutional, commercial, or office districts may contain substantial employment but remain concentrated within particular types of activity. Moderate scores can therefore characterize neighborhoods that contain some mixture of economic uses without approaching the greatest levels of employment diversity.
The results also demonstrate why Employment Mix should not be interpreted as a direct substitute for mixed land use generally. The measure concerns the diversity of employment represented within the EPA methodology. It does not independently establish whether housing, retail, parks, schools, sidewalks, or other destinations are conveniently arranged for pedestrians. Those characteristics must be interpreted alongside the other components of the National Walkability Index.
This distinction becomes especially important when comparing Employment Mix with the previous variables. Intersection Density describes the connectivity of the street network; Proximity to Transit describes access to transit service; Employment Mix describes the diversity of employment opportunities. A neighborhood can therefore perform strongly in one category while performing poorly in another. San Angelo demonstrates this particularly clearly: Downtown combines a high Intersection Density score (18.00) and high Employment Mix score (17.00) with the minimum Proximity to Transit score (1.00). Its component scores reveal a more nuanced built environment than its overall NWI score alone can show.
Another important finding is that Employment Mix appears to be less spatially predictable than Intersection Density or Proximity to Transit. Connected street grids frequently correspond to traditional urban development, while transit accessibility often follows identifiable transit corridors and metropolitan transit systems. Employment diversity, by comparison, depends heavily on the economic function and composition of individual neighborhoods. High values can therefore occur in downtowns, suburban centers, redevelopment districts, commercial corridors, and other employment concentrations.
Perhaps most importantly, the results again reinforce the value of neighborhood-scale analysis. Municipalities contain neighborhoods serving very different economic functions, and these differences produce substantial variation in employment diversity within the same city. Looking only at a citywide average would conceal the contrast between diversified employment centers, predominantly residential neighborhoods, specialized districts, and areas with relatively little employment activity.
Taken together, the Employment Mix results add an important economic dimension to the broader walkability analysis. The geographic patterns demonstrate that creating an environment supportive of walking involves more than constructing connected streets or providing transit. Neighborhoods also benefit when multiple types of employment and destinations are represented within relatively compact areas, increasing the potential for different activities to occur near one another. When Employment Mix is considered alongside Intersection Density, Proximity to Transit, and Employment-and-Household Mix, the result is a more complete picture of how transportation networks, land-use patterns, and economic activity interact to influence neighborhood walkability.
Why Employment Mix Matters
Neighborhood Employment Mix is more than a measure of how many jobs exist in an area—it measures the diversity of employment opportunities within a neighborhood. The U.S. Environmental Protection Agency (EPA) recognizes that walkable communities are characterized not only by the concentration of development but also by the diversity of destinations that residents can reach by walking, bicycling, or public transit (U.S. Environmental Protection Agency, 2021a)A neighborhood containing a balanced mix of employment types provides opportunities for people to access work, shopping, healthcare, education, entertainment, and public services without relying exclusively on automobiles (U.S. Environmental Protection Agency, 2021a)
The EPA developed the National Walkability Index to evaluate how well neighborhoods support walking as a practical mode of transportation. Within this framework, Employment Mix reflects one aspect of land use diversity, recognizing that different employment sectors are associated with different destinations and daily activities (U.S. Environmental Protection Agency, 2021b). For example, retail employment contributes shopping opportunities, healthcare employment provides access to medical services, educational employment supports schools and universities, while office and public administration employment represent important civic and economic destinations. When these employment types are located near one another, neighborhoods offer a greater variety of destinations that can encourage shorter trips and increase transportation choices (U.S. Environmental Protection Agency, 2021b, 2021a).
The EPA incorporates Neighborhood Employment Mix into the Smart Location Database as one of several indicators describing the built environment. Specifically, Employment Mix is included within the Employment and Housing Diversity (D2) measures, which evaluate the diversity of employment rather than simply the number of jobs in an area (U.S. Environmental Protection Agency, 2021b). This distinction is important because neighborhoods with a large concentration of jobs in a single industry may still require residents to travel elsewhere to meet many of their daily needs. In contrast, neighborhoods with a more balanced distribution of employment types provide a wider range of destinations that support everyday activities closer to where people live (U.S. Environmental Protection Agency, 2021b).
Because of this relationship, Neighborhood Employment Mix serves as an important indicator of land use diversity and neighborhood accessibility. Alongside measures such as intersection density, transit accessibility, and employment-household balance, it helps explain how the built environment influences travel behavior, transportation choice, and overall walkability (U.S. Environmental Protection Agency, 2021b, 2021a).
How Employment Diversity Benefits Everyday Life
Neighborhood Employment Mix is more than a planning metric—it helps explain how the diversity of destinations within a neighborhood influences everyday accessibility. The U.S. Environmental Protection Agency (EPA) recognizes that walkable communities provide convenient access to jobs, stores, schools, parks, services, and public transportation, allowing residents to complete more daily activities without relying exclusively on automobiles (U.S. Environmental Protection Agency, 2021a)
A neighborhood with a diverse mix of employment often supports a wider range of everyday destinations because different employment sectors are associated with different land uses and services. For example, retail employment provides shopping opportunities, healthcare employment supports access to medical services, educational employment includes schools and universities, while restaurants, entertainment venues, government offices, and professional businesses contribute additional destinations that residents may visit throughout the day (U.S. Environmental Protection Agency, 2021b)
This diversity can make neighborhoods more convenient for residents by increasing the likelihood that several daily activities can be completed within the same area. Instead of driving to multiple locations across a city, residents may be able to walk, bicycle, or use public transit to reach workplaces, grocery stores, restaurants, medical offices, schools, and other essential services located nearby. The EPA recognizes that this concentration of diverse destinations supports greater transportation choice and improves neighborhood accessibility (U.S. Environmental Protection Agency, 2021a)
Employment diversity also benefits people with different transportation needs. Children, older adults, individuals who do not own a vehicle, and residents who prefer walking, bicycling, or transit may have greater opportunities to reach important destinations when neighborhoods contain a balanced mix of employment types. By bringing a variety of services closer together, employment diversity can reduce the need for longer trips while supporting more connected and accessible communities (U.S. Environmental Protection Agency, 2021a)
Although Employment Mix is only one measure of the built environment, it complements other EPA indicators—such as intersection density, transit accessibility, and employment-household balance—to help explain how neighborhood design influences accessibility and travel options. Together, these measures provide a more complete understanding of how communities support walking and other forms of active transportation (U.S. Environmental Protection Agency, 2021b, 2021a).
Examples of Daily Activities Supported by Employment Diversity
Employment Category | Everyday Benefit |
Retail | Shopping for groceries, clothing, and household goods |
Healthcare | Visiting doctors, dentists, pharmacies, or clinics |
Education | Accessing schools, colleges, and libraries |
Restaurants & Services | Dining, banking, salons, and personal services |
Office Employment | Working close to other businesses and services |
Entertainment | Visiting museums, theaters, parks, or recreation facilities |
Public Administration | Accessing city halls, courthouses, and government services |
Why This Matters
The EPA’s Employment Mix metric is valuable because it shifts the focus from how many jobs are in a neighborhood to what opportunities those jobs create. A neighborhood with a balanced mix of employment types is more likely to provide residents with a variety of nearby destinations that support daily life. In combination with other built-environment measures, employment diversity helps planners evaluate how effectively neighborhoods promote accessibility, transportation choice, and walkability (U.S. Environmental Protection Agency, 2021b, 2021a).
Employment Mix vs. Employment Density
Although Employment Mix and Employment Density are closely related, they measure different characteristics of a neighborhood. The U.S. Environmental Protection Agency (EPA) distinguishes these measures within the Smart Location Database, where Employment Density (D1) and Employment and Housing Diversity (D2) are treated as separate indicators of the built environment (U.S. Environmental Protection Agency, 2021b).
Employment Density measures how many jobs are located within a given area. A neighborhood with thousands of jobs concentrated in office towers or an industrial park would have a high employment density because employment is heavily concentrated in one location. This metric helps describe the intensity of development but does not indicate whether those jobs represent a variety of destinations or land uses (U.S. Environmental Protection Agency, 2021b).
Employment Mix, by contrast, measures the diversity of employment types within a neighborhood rather than the total number of jobs. The EPA calculates this measure using an employment entropy index, which evaluates how evenly employment is distributed among several major employment categories. Neighborhoods containing a balanced mix of retail, office, healthcare, education, entertainment, public administration, service, and industrial employment receive higher Employment Mix values because they provide a broader range of destinations and activities (U.S. Environmental Protection Agency, 2021b)
This distinction is important because two neighborhoods can contain the same number of jobs while providing very different opportunities for walking and everyday accessibility. A neighborhood where nearly all jobs belong to a single industry may require residents to travel elsewhere for shopping, healthcare, education, or other daily needs. Conversely, a neighborhood with the same total number of jobs but distributed across many employment sectors offers a wider variety of destinations that can often be reached without driving (U.S. Environmental Protection Agency, 2021b)
In other words, Employment Density measures the quantity of jobs, whereas Employment Mix measures the diversity of destinations those jobs create. Together, these complementary metrics help explain how neighborhood development patterns influence accessibility, transportation choice, and walkability.
Quick Comparison Table
Characteristic | Employment Density | Employment Mix |
EPA Measure | D1 | D2 |
Measures | Number of jobs | Diversity of job types |
Focus | Quantity | Variety |
High Value Means | Many jobs in a neighborhood | Many different kinds of employment |
Example | Large office district | Office, retail, healthcare, education, restaurants, government, and services located together |
EPA Purpose | Measures development intensity | Measures land use diversity and destination variety |
Role in Walkability | Indicates where jobs are concentrated | Indicates whether neighborhoods provide a variety of nearby destinations |
Understanding Employment Entropy
The EPA measures Neighborhood Employment Mix using a concept called employment entropy. While the name may sound technical, the idea is straightforward: employment entropy measures how evenly different types of jobs are distributed within a neighborhood (U.S. Environmental Protection Agency, 2021b).
Imagine two neighborhoods that each contain 1,000 jobs.
Neighborhood A: Low Employment Entropy
Employment Type | Jobs |
Office | 900 |
Retail | 50 |
Healthcare | 25 |
Education | 15 |
Other Employment | 10 |
Total | 1,000 |
Nearly all employment is concentrated in a single industry. Although the neighborhood has many jobs, residents may still need to travel elsewhere for shopping, healthcare, entertainment, or other everyday services. Because employment is not evenly distributed across different sectors, this neighborhood has low employment entropy (U.S. Environmental Protection Agency, 2021b).
Neighborhood B: High Employment Entropy
Employment Type | Jobs |
Office | 200 |
Retail | 180 |
Healthcare | 170 |
Education | 160 |
Restaurants & Services | 150 |
Government | 140 |
Total | 1,000 |
This neighborhood contains the same total number of jobs, but they are spread across many employment sectors. As a result, residents have access to a wider variety of destinations—including workplaces, stores, restaurants, schools, healthcare facilities, and public services—within the same area. Because employment is more evenly distributed, this neighborhood has high employment entropy (U.S. Environmental Protection Agency, 2021b).
Why Does This Matter?
The EPA uses employment entropy because walkability depends on more than the number of jobs—it also depends on the variety of destinations available nearby (U.S. Environmental Protection Agency, 2021b). A neighborhood dominated by a single employment sector may generate many commuters but offer relatively few opportunities to complete daily activities on foot. In contrast, neighborhoods with a balanced mix of employment types support a broader range of trips and make it easier for residents to work, shop, access services, and meet everyday needs without relying exclusively on automobiles (U.S. Environmental Protection Agency, 2021b).
In simple terms:
Employment Density asks, “How many jobs are here?”
Employment Entropy asks, “How diverse are those jobs?”
Both measures are important, but they answer different questions about how neighborhoods function and how well they support walkability.
Employment Categories Used by the EPA
To measure Neighborhood Employment Mix, the U.S. Environmental Protection Agency (EPA) does not simply count the total number of jobs within a neighborhood. Instead, it evaluates how employment is distributed across several major employment sectors. These categories represent different types of destinations that contribute to a neighborhood’s accessibility and land use diversity (U.S. Environmental Protection Agency, 2021b)
The EPA’s Employment and Housing Diversity (D2) metric uses employment data derived from the Longitudinal Employer-Household Dynamics (LEHD) program and groups jobs into the following categories (U.S. Environmental Protection Agency, 2021b)
Employment Category | Examples of Destinations |
Retail | Grocery stores, clothing stores, pharmacies, shopping centers |
Office | Professional offices, financial institutions, technology companies, administrative businesses |
Industrial | Manufacturing facilities, warehouses, logistics centers, construction support |
Service | Restaurants, hotels, salons, repair shops, personal services |
Entertainment | Movie theaters, museums, sports venues, recreation facilities |
Education | Schools, colleges, universities, libraries |
Healthcare | Hospitals, medical offices, clinics, dental practices |
Public Administration | City halls, courthouses, government offices, public safety facilities |
Each employment category contributes a different type of destination within a neighborhood. For example, retail employment provides opportunities for shopping, healthcare employment supports access to medical services, educational employment represents schools and universities, while public administration includes important civic destinations. By measuring how evenly employment is distributed across these sectors, the EPA evaluates whether a neighborhood offers a diverse range of places that residents can access during their daily activities (U.S. Environmental Protection Agency, 2021b).
A neighborhood that contains employment across many of these categories generally has a higher Employment Mix score than one where most jobs are concentrated in a single sector. This diversity of destinations supports one of the primary goals of the National Walkability Index—identifying neighborhoods where residents have greater opportunities to complete daily activities without relying exclusively on automobiles (U.S. Environmental Protection Agency, 2021b).
Why These Categories Matter
The EPA includes multiple employment sectors because walkability is influenced by the variety of destinations available within a neighborhood, not simply the number of jobs (U.S. Environmental Protection Agency, 2021b). A neighborhood containing offices, restaurants, schools, healthcare facilities, retail businesses, and government services provides residents with more opportunities to walk for work, shopping, education, recreation, and other everyday needs than a neighborhood dominated by a single employment type.
Technical Note: The EPA derives these employment categories from the Longitudinal Employer-Household Dynamics (LEHD) database using North American Industry Classification System (NAICS) sectors. These categories are then incorporated into the Employment and Housing Diversity (D2) metric used by the Smart Location Database (U.S. Environmental Protection Agency, 2021b).
How Neighborhood Employment Mix Fits Within the EPA Framework
The U.S. Environmental Protection Agency (EPA) developed several complementary measures to describe the built environment. Rather than relying on a single indicator, the EPA evaluates neighborhood accessibility using multiple characteristics that capture development intensity, land use diversity, transportation options, and destination accessibility (U.S. Environmental Protection Agency, 2021b, 2021a).
Neighborhood Employment Mix is one of these complementary measures. It represents the diversity of employment opportunities within a neighborhood and contributes to understanding how land use patterns influence accessibility and walkability. Together with other EPA measures, it provides planners and researchers with a more complete picture of how neighborhoods function.
EPA Built Environment Framework
EPA Built Environment Measures
│
├── Development Intensity
│ ├─ Population Density
│ ├─ Employment Density
│ └─ Floor Area Ratio
│
├── Land Use Diversity
│ ├─ Employment Mix
│ ├─ Employment-Household Mix
│ └─ Land Use Mix
│
├── Street Network
│ └─ Intersection Density
│
├── Transportation
│ └─ Transit Accessibility
│
└── Destination Accessibility
└─ Access to Jobs and Services
Relationship to the National Walkability Index
The National Walkability Index draws upon several built-environment characteristics to evaluate how supportive a neighborhood is for walking. While Neighborhood Employment Mix is not itself a direct component of the National Walkability Index, it measures an important aspect of land use diversity that complements the Index and provides additional insight into neighborhood accessibility (U.S. Environmental Protection Agency, 2021b, 2021a).
Together, these EPA measures help explain not only whether people can walk, but also whether there are diverse destinations worth walking to.
Limitations of Neighborhood Employment Mix
While Neighborhood Employment Mix provides valuable insight into the diversity of employment opportunities within a neighborhood, it should not be interpreted as a complete measure of walkability or neighborhood quality. The U.S. Environmental Protection Agency (EPA) developed this metric to evaluate one aspect of the built environment—the diversity of employment destinations—rather than every factor that influences walking behavior (U.S. Environmental Protection Agency, 2021b, 2021a)
One important limitation is that Employment Mix measures the distribution of employment across different sectors, not the quality, size, or attractiveness of individual businesses or destinations. Two neighborhoods may receive similar Employment Mix scores even if one contains thriving businesses while another contains vacant storefronts or underutilized commercial properties (U.S. Environmental Protection Agency, 2021b).
Additionally, the metric does not evaluate the pedestrian environment itself. Employment Mix does not measure sidewalk conditions, crosswalk safety, bicycle infrastructure, street lighting, traffic speeds, street trees, building design, or other features that influence whether walking is comfortable or safe. These characteristics are important components of walkability but fall outside the scope of the Employment Mix metric (U.S. Environmental Protection Agency, 2021a).
Employment Mix also reflects the availability of different employment types, rather than whether residents actually choose to walk. Individual travel behavior is influenced by many factors beyond land use, including household preferences, income, age, disability, vehicle ownership, weather, and local transportation policies. As a result, neighborhoods with high Employment Mix scores may still experience substantial automobile travel depending on local conditions (U.S. Environmental Protection Agency, 2021a)
Finally, Employment Mix should be interpreted alongside other measures of the built environment. The EPA emphasizes that walkability results from multiple complementary characteristics, including street connectivity, transportation accessibility, development intensity, and the balance between employment and housing. Considering these measures together provides a more comprehensive understanding of neighborhood accessibility than relying on any single indicator alone (U.S. Environmental Protection Agency, 2021b, 2021a).
References
- Cervero, R., & Kockelman, K. (1997). Travel demand and the 3Ds: Density, diversity, and design. Transportation Research Part D: Transport and Environment, 2(3), 199–219. https://doi.org/10.1016/S1361-9209(97)00009-6
- Ewing, R., & Cervero, R. (2010). Travel and the Built Environment: A Meta-Analysis. Journal of the American Planning Association, 76(3), 265–294. https://doi.org/10.1080/01944361003766766
- Faraudo, F. (2025, February 23). How Mixed-Use Developments Are Connecting with Their Neighborhoods, Not Replacing Them. Propmodo. https://propmodo.com/how-mixed-use-developments-are-connecting-with-their-neighborhoods-not-replacing-them/
- Frank, L. D., Schmid, T. L., Sallis, J. F., Chapman, J., & Saelens, B. E. (2005). Linking objectively measured physical activity with objectively measured urban form. American Journal of Preventive Medicine, 28(2), 117–125. https://doi.org/10.1016/j.amepre.2004.11.001
- S. Environmental Protection Agency. (2021a). National Walkability Index: Methodology and User Guide. U.S. Environmental Protection Agency (EPA). https://www.epa.gov/smartgrowth/smart-location-mapping#walkability
- S. Environmental Protection Agency. (2021b). Smart Location Database (SLD) 3.0: Technical Documentation and User Guide. U.S. Environmental Protection Agency. https://www.epa.gov/smartgrowth/smart-location-database-technical-documentation-and-user-guide