Planning & Walkability Analysis

Executive Summary
The Atlas combines ArcGIS Pro, interactive web mapping, and pedestrian service area analysis to examine walkability and accessibility at metropolitan, municipal, and neighborhood scales. The Atlas combines ArcGIS Pro, interactive web mapping, and pedestrian service area analysis to examine walkability at metropolitan, municipal, and neighborhood scales.
By integrating the EPA’s National Walkability Index with network-based accessibility analysis, the Atlas supports planners, researchers, local governments, and residents in understanding how the built environment influences walking and access to everyday destinations.
Better understanding walkability can inform comprehensive planning, transportation planning, economic development, public health initiatives, and neighborhood revitalization. The Atlas is intended as a diagnostic planning resource and should be interpreted alongside local knowledge, field observations, and complementary datasets.
Project Highlights
- Explore walkability across 6,255 municipalities.
- Compare walkability at metropolitan, municipal, and neighborhood
- Analyze data from over 250,000 Census block groups.
- Explore 2,740 neighborhood profiles.
- Evaluate pedestrian accessibility using network-based service area analysis.
- View interactive GIS maps built from EPA and U.S. Census data.
- Support planning, research, and informed community decision-making.
- Understand both the capabilities and limitations of the National Walkability Index.
Contributions of the American Walkability Atlas
The American Walkability Atlas extends the application of the EPA’s National Walkability Index through original GIS workflows, comparative spatial analysis, and interactive web mapping. Its primary contributions include:
- Expanding the EPA’s four walkability classifications into a seven-class visualization that improves geographic differentiation and map readability.
- Making nationwide walkability analysis publicly accessible through interactive GIS web maps at metropolitan, municipal, and neighborhood scales.
- Enabling consistent comparisons of walkability across metropolitan areas, municipalities, and neighborhoods using a common analytical framework.
- Combining national walkability metrics with network-based pedestrian accessibility analysis to provide a more comprehensive understanding of neighborhood accessibility.
- Transforming federal planning datasets into accessible decision-support tools through GIS analysis, interactive web mapping, and spatial visualization.
- Extending nationwide walkability analysis to 2,740 neighborhood profiles, allowing users to explore walkability at a finer geographic scale than municipal summaries alone.
- Promoting transparent and responsible interpretation of walkability data by documenting methodological assumptions, limitations, and appropriate applications.
By combining nationally consistent EPA walkability data with GIS-based accessibility analysis and interactive visualization, the Atlas provides planners, researchers, local governments, and residents with a richer understanding of how the built environment influences pedestrian accessibility and neighborhood connectivity.
Together, these contributions transform the EPA’s National Walkability Index from a static federal dataset into an interactive planning resource that supports research, policy analysis, and informed decision-making at multiple geographic scales.
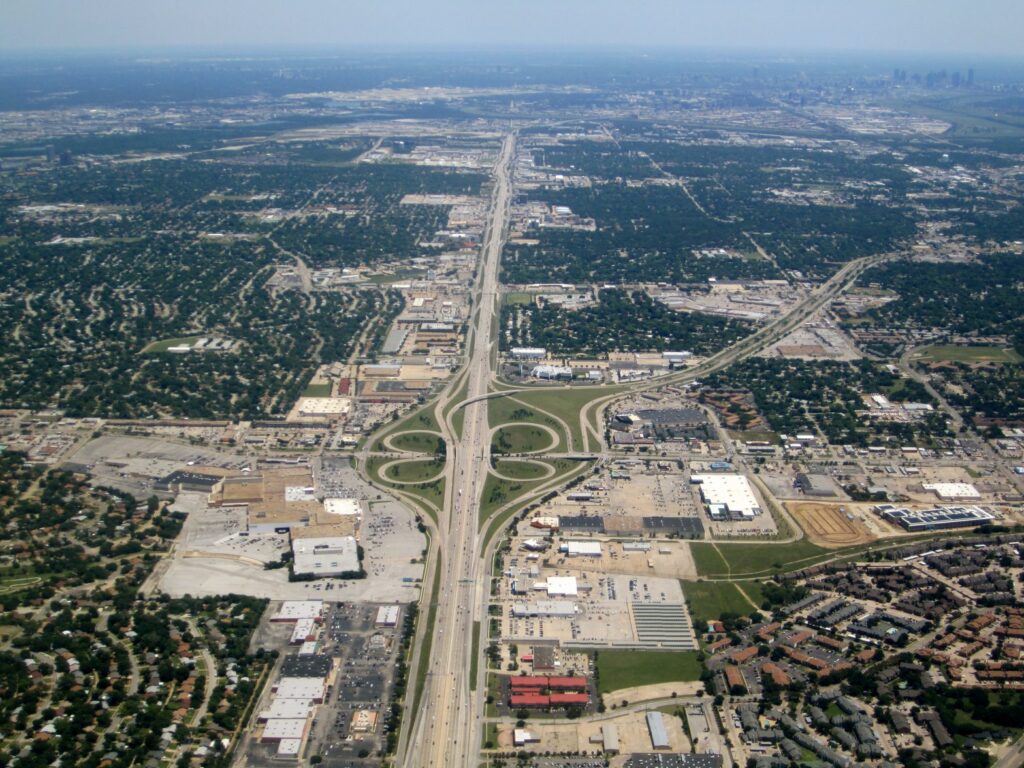
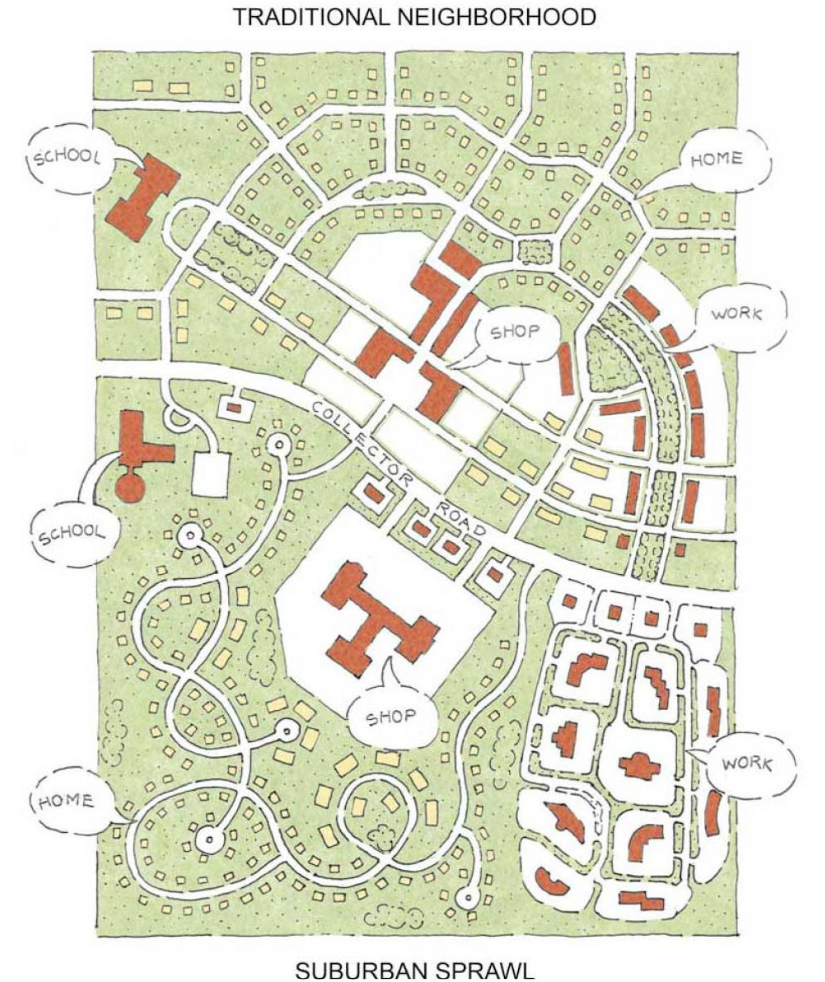
Suburban sprawl is a modern development pattern consisting of carefully separated, single-use pods connected by an extensive road network. Unlike traditional neighborhoods, where daily needs are within walking distance, suburban sprawl generally requires automobile travel to reach homes, workplaces, shopping, schools, and services (Duany et al., 2010). This aerial view illustrates the low-density, automobile-oriented urban form that has become common throughout much of the United States. Photo courtesy of Harry (2018).
Research Methodology
Overview
The American Walkability Atlas evaluates and visualizes walkability across the United States by integrating the U.S. Environmental Protection Agency’s (EPA) National Walkability Index with U.S. Census geography, municipal boundaries, and network-based GIS analysis. Rather than creating a new walkability index, the Atlas builds upon the EPA’s established methodology by enhancing visualization, enabling multi-scale comparisons, and incorporating pedestrian accessibility analysis through interactive web mapping (U.S. Environmental Protection Agency, 2021a)
Research Objectives
The project was designed to:
- Improve public access to nationwide walkability information through interactive GIS mapping.
- Compare walkability across municipal and neighborhood scales using a consistent analytical framework.
- Integrate network-based pedestrian accessibility analysis with EPA walkability scores.
- Demonstrate practical GIS workflows for planning and spatial analysis.
- Promote transparent and responsible interpretation of walkability data through documented methods and limitations.
EPA National Walkability Index
The American Walkability Atlas is built upon the EPA’s National Walkability Index, which evaluates walkability at the Census block group level using characteristics of the built environment associated with walking behavior (U.S. Environmental Protection Agency, 2021a). The Index is based on three primary dimensions:
- Design – street connectivity measured through intersection density.
- Distance – residential proximity to public transit.
- Diversity – the mix of employment, housing, and destinations.
These dimensions are represented through four standardized indicators—intersection density, proximity to transit, employment mix, and employment-household mix—which generate walkability scores ranging from 1 to 20, with higher values indicating greater walkability (U.S. Environmental Protection Agency, 2021a; Watson et al., 2020)
Data Sources and GIS Workflow
The Atlas integrates publicly available datasets from the EPA National Walkability Index, U.S. Census Bureau Census Block Groups, U.S. Census TIGER/Line municipal boundaries, and ArcGIS Online Network Analysis Services (U.S. Environmental Protection Agency, 2021a)
Spatial analysis and map production were completed primarily in ArcGIS Pro, with ArcGIS Online, QGIS, qgis2web, WordPress, Elementor, and HTML/CSS supporting data preparation, cartographic design, interactive web mapping, and website development.
The analytical workflow follows a consistent sequence:
EPA National Walkability Index
↓
ArcGIS Pro Processing
↓
Municipal Boundary Integration
↓
Seven-Class Walkability Classification
↓
Interactive Web Maps
↓
Pedestrian Service Area Analysis
Prior to analysis, datasets were standardized through coordinate system verification, attribute validation, municipal boundary integration, neighborhood preparation, and standardized naming conventions to ensure consistency throughout the Atlas.
Geographic Scope and Spatial Analysis
To support nationwide analysis, municipal boundary datasets from all fifty states were merged into a single national layer. The Atlas primarily includes municipalities with populations of 5,000 or more, while selectively incorporating smaller communities where appropriate using U.S. Census Bureau geographic definitions.
Census block groups are assigned to municipalities using centroid-based spatial selection, ensuring that walkability scores are consistently associated with the communities being analyzed.
Walkability is evaluated at both municipal and neighborhood scales. Municipal averages facilitate comparisons among cities, while neighborhood analyses reveal localized variations that may be obscured by citywide averages. Examining multiple geographic scales provides a more comprehensive understanding of spatial variation in walkability (U.S. Environmental Protection Agency, 2021a)
Walkability Classification
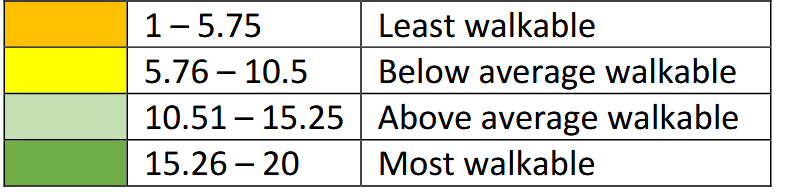
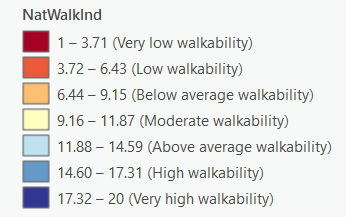
The Atlas uses the EPA National Walkability Index as its underlying measure of neighborhood walkability (U.S. Environmental Protection Agency, 2021a). While the EPA groups walkability into four general categories, the American Walkability Atlas expands this into a seven-class visualization to improve geographic differentiation, map readability, and interpretation of localized spatial patterns.
The seven-class system enhances visualization only; it does not modify the underlying EPA walkability scores or methodology (U.S. Environmental Protection Agency, 2021a; Watson et al., 2020)
The figure below compares:
- Left: EPA’s original four-class legend (U.S. Environmental Protection Agency, 2021a; Watson et al., 2020)
- Right: Seven-class classification developed specifically for the American Walkability Atlas
Neighborhood-Level Classification Methods
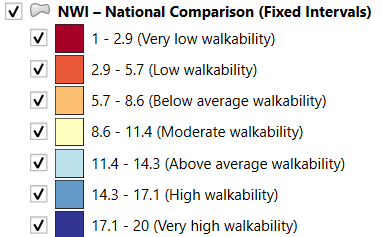
As the American Walkability Atlas expands its analysis to the neighborhood level, the Atlas provides two seven-class approaches for visualizing neighborhood conditions: Fixed Interval and Natural Breaks (Jenks). These classifications provide two complementary perspectives. Fixed intervals allow neighborhood values to be interpreted against a consistent scale, while Natural Breaks emphasizes patterns and differences within the distribution of the data being mapped.
The choice of classification method is important because class boundaries influence how geographic patterns are communicated on a choropleth map. Cartographic research has long recognized that different classification techniques can produce different visual interpretations of the same underlying values. Jenks and Caspall (1971), for example, examined classification in terms of reducing error and improving the information communicated through choropleth maps, while subsequent research has continued to demonstrate the importance of classification method in map interpretation (Jenks & Caspall, 1971; Smith, 1986).
Fixed Interval — Standardized Patterns
The Fixed Interval classification used by the American Walkability Atlas divides the common index scale into seven predetermined intervals. Because the interval size is established in advance, the numerical meaning of each category remains consistent rather than changing in response to the distribution of neighborhoods being mapped.
The concept is closely related to the traditional equal-interval classification method. QGIS defines Equal Interval as a method in which each class has the same numerical size; for example, dividing values from 0 to 16 into four classes produces intervals of four units each (QGIS Project, n.d.). In the Atlas, the same general principle is applied through predetermined fixed ranges appropriate to the index scale.
This consistency is particularly important when examining neighborhoods across municipalities. Because the boundaries do not change according to the distribution of values in an individual city, the classification provides a stable reference for determining where a neighborhood falls on the overall scale.
In other words, Fixed Interval is designed primarily to answer:
Where does this neighborhood fall on a consistent measurement scale?
This standardized approach is valuable when comparisons between different geographic areas are an important objective. Research by Brewer and Pickle (2002) also demonstrates the broader importance of maintaining matched legends when comparing a series of choropleth maps; in their experimental study, matched legends substantially improved map-comparison accuracy.
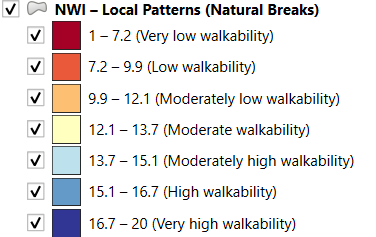
Natural Breaks (Jenks) — Local Patterns
The Natural Breaks (Jenks) classification serves a different purpose. Instead of imposing equally sized or predetermined intervals, Natural Breaks identifies groupings based on the distribution of the observed values.
QGIS describes the Jenks method as minimizing variance within individual classes while maximizing variance between classes (QGIS Project, n.d.). This principle reflects the broader cartographic work of George F. Jenks and Fred C. Caspall, whose influential 1971 study examined methods for reducing classification error in choropleth mapping and improving the map’s ability to communicate information.
This distinction has an important consequence for interpreting the American Walkability Atlas:
Natural Breaks does not produce consistently sized classification ranges.
Unlike Fixed Interval, there is no requirement that one Natural Breaks category cover the same number of index points as another. The location of the breaks is determined by the statistical distribution of the particular dataset being classified.
That can already be seen in the Atlas’s neighborhood indicators. For example, the first Natural Breaks category extends from 1–7.2 for the National Walkability Index, 1–6.5 for Intersection Density, 1–3.8 for Proximity to Transit, and 1–4.2 for both Employment Mix and Employment/Household Mix. The widths of the remaining classes likewise vary.
These unequal ranges are intentional. They occur because the Natural Breaks method is attempting to group relatively similar observations while distinguishing them from other groups in the distribution, rather than dividing the entire scale into equal numerical increments. QGIS’s implementation explicitly describes Jenks in terms of minimizing within-class variance and maximizing between-class variance (QGIS Project, n.d.).
Consequently, Natural Breaks is designed primarily to answer:
Where are the meaningful groupings and contrasts within the data being mapped?
Why Natural Breaks Is Useful for Neighborhood Analysis
This makes Natural Breaks particularly useful as a local-pattern layer in the American Walkability Atlas. Neighborhood conditions within a city are not necessarily distributed evenly across the underlying scale. A large proportion of neighborhoods might cluster within one portion of the distribution, while relatively few neighborhoods occupy the highest or lowest portions.
A fixed classification preserves the absolute meaning of the scale, but it may sometimes place many similar neighborhoods into the same broad category. Natural Breaks can provide additional differentiation because the class boundaries respond to concentrations and gaps within the observed values.
This is consistent with the broader purpose of choropleth classification. Smith (1986) explains that a common objective of classifying choropleth data is to create classes containing relatively similar values, although his comparison also demonstrates that no single traditional classification method performs best for every type of data distribution.
That is an important reason for providing both classifications rather than treating either method as universally superior.
Why the Atlas Provides Both
The two neighborhood layers should therefore be understood as complementary rather than competing representations.
Fixed Interval provides a standardized perspective: Where does the neighborhood fall on the common index scale?
Natural Breaks provides a local-pattern perspective: How does the neighborhood relate to statistical groupings and contrasts in the data being mapped?
This distinction also explains why the same neighborhood can appear in different descriptive categories under the two methods without its underlying score changing. The neighborhood’s value remains the same; what changes is the method used to establish the class boundaries.
The unequal ranges found in Natural Breaks are therefore an important part of interpreting these maps. A category such as “High” should always be read together with the numerical range shown in that map’s legend. Unlike the Fixed Interval classification, a Natural Breaks category does not necessarily correspond to an identical numerical range across different indicators or datasets.
For this reason, the Atlas uses the term “Local Patterns (Natural Breaks)” for these layers. Fixed Interval provides the more appropriate standardized reference for comparing values using common thresholds, while Natural Breaks provides an additional way of identifying local concentrations, transitions, and contrasts among neighborhoods.
Pedestrian Accessibility Analysis
To complement walkability scores, the Atlas incorporates network-based pedestrian service area analysis. Unlike straight-line (Euclidean) distance, service area analysis follows actual pedestrian travel routes along the street network, providing a more realistic representation of accessibility.
This approach provides additional insight into:
- pedestrian connectivity;
- access to destinations;
- street network structure; and
- neighborhood accessibility.
These analyses are intended to supplement—not replace—the EPA National Walkability Index.
Quality Assurance and Reproducibility
Quality assurance procedures included visual inspection of maps, attribute verification, validation of spatial joins, consistency checks across geographic scales, and review of interactive web map functionality.
Because the Atlas relies on publicly available federal datasets and documented GIS workflows, the methodology is designed to be transparent and reproducible, allowing planners, researchers, and students to understand and adapt similar analytical approaches (U.S. Environmental Protection Agency, 2021a)
Limitations
The American Walkability Atlas is intended as a diagnostic planning resource rather than a definitive measure of neighborhood quality.
The National Walkability Index is based on selected characteristics of the built environment and does not directly account for factors such as sidewalk condition, lighting, crime, topography, weather, pedestrian comfort, or observed walking behavior (U.S. Environmental Protection Agency, 2021a)Likewise, municipal averages may mask substantial neighborhood-level variation.
Accordingly, Atlas results should be interpreted alongside local knowledge, field observations, planning documents, and complementary datasets.
Contributions
The American Walkability Atlas extends the practical application of the EPA National Walkability Index by (U.S. Environmental Protection Agency, 2021b, 2021a)
- expanding the EPA’s four-class visualization into a seven-class classification;
- integrating walkability metrics with network-based pedestrian accessibility analysis;
- supporting consistent comparisons across municipal and neighborhood scales;
- making nationwide walkability analysis publicly accessible through interactive GIS web maps;
- providing localized neighborhood profiles; and
- promoting transparent documentation of analytical methods and project limitations.
Together, these contributions transform the EPA’s National Walkability Index from a static federal dataset into an interactive planning resource that supports research, policy analysis, and informed decision-making at multiple geographic scales.
Planning & GIS Services
Supporting planners, municipalities, researchers, and organizations through GIS analysis, spatial visualization, walkability mapping, and neighborhood accessibility research.
Municipal Walkability
Compare overall walkability across municipalities using the EPA National Walkability Index.
Service Area Accessibility
Measure areas reachable within walking time using real pedestrian street networks.
Neighborhood Walkability
Analyze how walkability varies between neighborhoods within the same city.
Planning Research Report
Review detailed planning reports that use GIS mapping, spatial analysis, and evidence-based research to support planning and policy decisions.
Challenges, Limitations, and Purpose of Research
Challenges of Website Building and Graphics Visualization
Development of what would become the American Walkability Atlas began in early August 2025. At the outset, I had no prior experience in website development and therefore relied on online tutorials and a process of trial and error to acquire the necessary skills. After evaluating several hosting platforms, Hostinger was selected, and the website was developed using Elementor as the primary design tool.
Once the website was operational, I began uploading static PDF map outputs generated in ArcGIS Pro. At this stage, several limitations became apparent. PDF maps can display only a limited number of layers and labels effectively, and the volume of content required for the project was substantial. Specifically, the website required five maps per Metropolitan Statistical Area (the National Walkability Index and four component variables: intersection density, proximity to transit, employment mix, and employment–household mix), as well as an additional five maps for each city analyzed at the neighborhood level. Presenting this volume of static maps would have resulted in an unwieldy and visually overwhelming user experience.
To address this challenge, the ArcGIS Pro projects were migrated to ESRI’s ArcGIS Online platform, allowing the maps to be presented in an interactive format. These interactive maps were then embedded into the website, enabling users to select individual municipalities or neighborhoods and view associated attribute information, including the National Walkability Index score and the scores for each of the four contributing variables.
However, the use of ArcGIS Online introduced another constraint: hosting large geospatial datasets requires paid credits and given the scale of the data used in this project, available credits were exhausted in less than one week. To resolve this issue, I transitioned the workflow to the open-source QGIS platform. All ArcGIS Pro projects were transferred to QGIS, and after becoming proficient with the software, I exported the interactive maps as standalone HTML files. Because these HTML files were initially private, they were first uploaded to GitHub to make them publicly accessible prior to embedding them on the website.
Further technical limitations arose during the GitHub hosting process. While neighborhood-level city files uploaded without issue, the municipality-level datasets posed significant challenges due to file size. Each set of five municipality maps (the National Walkability Index and four component variables) exceeded 100 MB, far surpassing GitHub’s 25 MB file size limit (100 MB if you go through GitHub Desktop). An initial solution involved dividing the municipality maps by broad U.S. regions (Northeast, South, Midwest, and West); however, the South, Midwest, and West regions remained too large to host as single files. As a result, the data were further subdivided by Census divisions. Since early 2026 until July that same year, the municipality-level section of the website is organized into six map groupings, structured as follows: New England & Mid-Atlantic (Northeast), South Atlantic & East South Central, West South Central, East North Central, West North Central & Mountain, and Pacific
As of July 2026, the municipality-level section of the website has been reorganized into two regional groupings:
- East
- Alabama (AL)
- Arkansas (AR)
- Connecticut (CT)
- Delaware (DE)
- District of Columbia (DC)
- Florida (FL)
- Georgia (GA)
- Illinois (IL)
- Indiana (IN)
- Iowa (IA)
- Kentucky (KY)
- Louisiana (LA)
- Maine (ME)
- Maryland (MD)
- Massachusetts (MA)
- Michigan (MI)
- Minnesota (MN)
- Mississippi (MS)
- Missouri (MO)
- New Hampshire (NH)
- New Jersey (NJ)
- New York (NY)
- North Carolina (NC)
- Ohio (OH)
- Pennsylvania (PA)
- Rhode Island (RI)
- South Carolina (SC)
- Tennessee (TN)
- Vermont (VT)
- Virginia (VA)
- West Virginia (WV)
- Wisconsin (WI)
- West
- Alaska (AK)
- Arizona (AZ)
- California (CA)
- Colorado (CO)
- Hawaii (HI)
- Idaho (ID)
- Kansas (KS)
- Montana (MT)
- Nebraska (NE)
- Nevada (NV)
- New Mexico (NM)
- North Dakota (ND)
- Oklahoma (OK)
- Oregon (OR)
- South Dakota (SD)
- Texas (TX)
- Utah (UT)
- Washington (WA)
- Wyoming (WY)
This organizational structure allowed the project to remain within hosting constraints while maintaining usability and ensuring that large-scale, municipality-level walkability data could be accessed efficiently.
Weaknesses/Limitations
It should be noted that the data presented in the American Walkability Atlas should not be interpreted as a definitive or comprehensive assessment of pedestrian conditions. While the National Walkability Index (NWI) is a valuable analytical tool, it has several important limitations that warrant consideration.
- Limited Representation of Pedestrian Infrastructure Quality
The National Walkability Index is derived primarily from land-use and built environment variables—specifically street intersection density, proximity to transit, and land-use diversity. As a result, it does not account for critical pedestrian infrastructure and design features observable at the street level, including:
- the presence and condition of sidewalks
- curb ramps and accessibility for people with disabilities
- shade, lighting, seating, and other amenities that influence pedestrian comfort and usability
Because these elements are excluded, areas may receive relatively high walkability scores despite offering substandard or uncomfortable walking environments (America Walks, n.d.; McGinn, 2025).
- Omission of Safety and Micro-Environmental Factors
The Index also omits direct measures of pedestrian safety and perceived security, such as:
- pedestrian crash data and traffic speeds
- safe crossing infrastructure (e.g., marked crosswalks, refuge islands)
- crime rates or perceptions of personal safety
Consequently, some areas may score highly due to favorable spatial configurations while remaining places where walking is unsafe or unattractive in practice (Pinski & McCarthy, 2023).
- Methodological Focus on Indicators, Not Actual Behavior
The Index is a proxy measure using built environment characteristics rather than direct measures of walking:
- It doesn’t measure how much people actually walk.
- It can overestimate walkability where environmental conditions discourage walking despite high accessibility (e.g., long, unsafe street crossings).
This means the NWI reflects potential walkability more than real human behavior (Steuteville, 2019).
- Doesn’t Include Non-Built Environment Influences
Critical influences on walkability such as:
- weather conditions
- topography (e.g., steep streets)
- social perceptions of walkability
- cultural or lifestyle patterns
are not captured, although they affect whether people choose to walk (Steuteville, 2019).
Illustrative Case: International Market Place, Indianapolis
The limitations described above are illustrated by the example of the International Market Place neighborhood in Indianapolis. The neighborhood boundary (shown in red) contains a single Census block group (shown in yellow) whose centroid falls within the neighborhood. This block group receives a National Walkability Index score of 16.83, with an intersection density score of 16, a proximity to transit score of 18, an employment mix score of 14, and an employment–household mix score of 19.
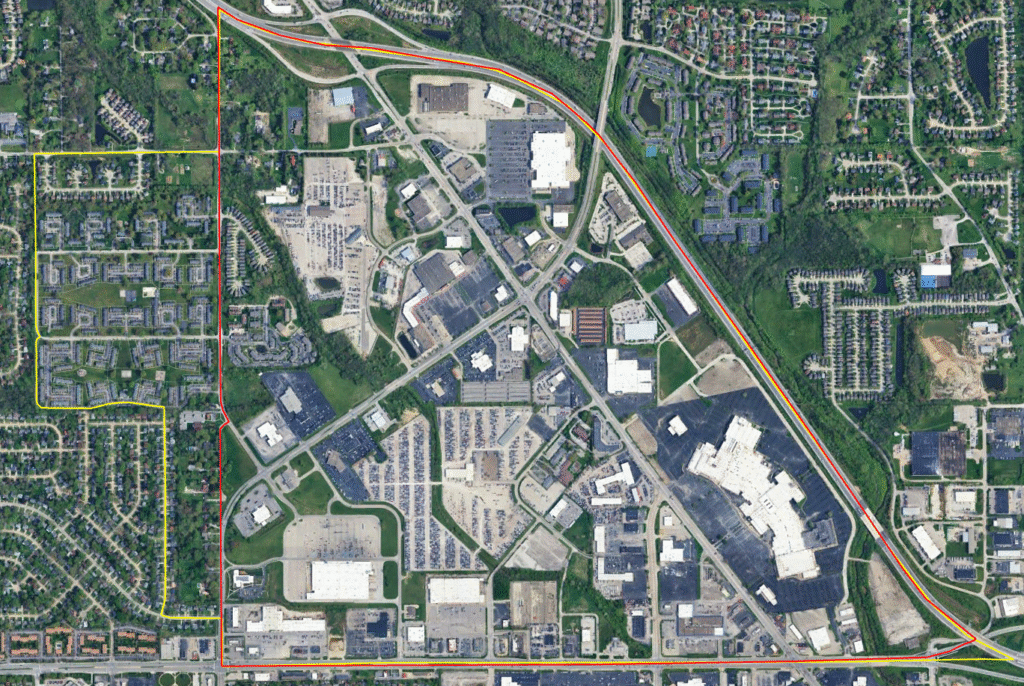
At face value, these values suggest a highly walkable environment. However, visual inspection of the area reveals conditions that are largely inhospitable to pedestrians. Consistent with many postwar development patterns, the street design prioritizes vehicular movement over pedestrian comfort—an approach succinctly characterized by Duany & Plater-Zyberk (1992) as designing places where “cars must be happy.”
Sidewalk coverage is sparse, and where sidewalks do exist, pedestrians are often constrained between high-speed traffic on one side and expansive surface parking lots on the other. In genuinely walkable environments, on-street parking frequently serves as both a physical and psychological buffer between pedestrians and moving vehicles—an element notably absent in this case.
Additional barriers include the spatial separation of residential uses from nearby retail and industrial destinations. While walking between these uses may be theoretically possible, the lack of direct, comfortable, and safe pedestrian connections makes automobile travel the de facto mode of access. Despite its high NWI score, the International Market Place more closely resembles suburban commercial sprawl than a traditional, pedestrian-oriented neighborhood (Steuteville, 2016).
- Geographic Scale Issues (Census Block Groups)
The NWI is calculated at the census block group level, which can be quite large or heterogeneous. This introduces two problems:
- Local walkable pockets within a block group may be averaged with non-walkable areas, lowering the score.
- Conversely, areas with poor walking environments but nearby amenities can score higher than actual conditions suggest.
This spatial aggregation can mask fine-grained variations that matter to pedestrians (Steuteville, 2019).
Another limitation of using Census block group–level data is that many municipalities—particularly very small or rural jurisdictions—are too small to contain a block group centroid. In some cases, multiple municipalities fall within a single block group, making it difficult to assign distinct and representative walkability scores to each jurisdiction.
Similar issues arise at the neighborhood scale. For example, users familiar with Columbus, Ohio, may notice that Wolfe Park is not included in the neighborhood-level interactive maps. Due to its very small geographic footprint, this neighborhood was excluded from the analysis. A comparable issue occurs in Dallas, Texas, where larger districts such as Northeast Dallas can be further subdivided into distinct neighborhoods, including Deep Ellum, Bryan Place, and Lower Greenville. Downtown Dallas presents a similar challenge, as it can be divided into eight subdistricts: the Arts District, City Center District, Convention Center District, Farmers Market District, Government District, Main Street District, Reunion District, and the West End Historic District.
At present, Fort Worth has not been analyzed at the neighborhood scale because many of its neighborhoods are too small to be meaningfully evaluated using block group–level data. While Census block–level data would offer greater spatial precision and potentially resolve some of these issues, it introduces additional methodological challenges due to the extremely small size of individual blocks. These challenges can replicate the same aggregation and interpretation issues observed with block groups in dense urban environments, which are discussed in the following section.
- Less Effective in Very Dense Urban Contexts
Some analysts note the Index may undervalue extremely dense, highly walkable cities because:
- Block groups in dense cities are geographically small and may lack sufficient land-use diversity within the block group itself (even though adjacent areas are highly walkable).
This can make scores less intuitive in downtown or urban core environments (America Walks, n.d.).
- Composite Nature Can Mask Key Variables
Because the Index combines different variables into a single score:
- One dominant component (e.g., transit proximity) can drive the score even if others (like intersection density) are weak.
- This makes it hard to interpret which specific elements most influence the score in any given place (Pinski & McCarthy, 2023).
As noted previously with the example of International Market Place in Indianapolis—where an area is classified as highly walkable despite offering poor pedestrian conditions—the opposite limitation can also occur. Some of the most genuinely walkable urban environments receive relatively low National Walkability Index (NWI) scores. This outcome reflects the Index’s reduced effectiveness in very dense urban contexts and the challenges associated with aggregating multiple variables into a single composite score. New York City provides a clear illustration of this limitation.
When evaluated alongside other U.S. municipalities, New York City exhibits a relatively low overall NWI score and is classified only as above average in walkability. This result is driven primarily by low intersection density values, particularly within Manhattan. At face value, this finding appears counterintuitive, as Manhattan is widely recognized as one of the most walkable urban environments in the United States.
The discrepancy arises from the extremely small size of many Census block groups in midtown and upper Manhattan. In numerous cases, these block groups encompass only a single city block and therefore contain no intersections within their boundaries. This pattern became evident during neighborhood-level analysis. While lower Manhattan appears less affected by this issue, the prevalence of small block groups elsewhere in the borough substantially suppresses intersection density scores and, by extension, the overall NWI score for the city.
Although employment mix and employment–household mix scores are also relatively low for New York City, a comprehensive assessment of these variables is still in progress. At the time of writing, analysis has been completed only for the boroughs of Staten Island and Manhattan. Further evaluation of the remaining boroughs is expected to provide greater insight into the factors influencing these components of the Index.
- Irregular Data Updates / Data Currency
The publicly released NWI is based on datasets from around 2017–2020, meaning:
- scores may lag behind current land-use or infrastructure changes.
- trends (e.g., new mixed-use developments or new transit service) may not be reflected until a future update (America Walks, n.d.).
Who This Is For
The American Walkability Atlas supports organizations and individuals seeking to better understand walkability patterns and the built environment. It is particularly valuable for:
- Municipal planning departments evaluating neighborhood accessibility and informing long-range planning efforts.
- Metropolitan Planning Organizations (MPOs) studying regional transportation and land-use patterns.
- Transportation planners assessing multimodal accessibility and pedestrian connectivity.
- Private planning and engineering consultants seeking comparative walkability data and visualization tools.
- Economic development organizations identifying areas that support walkable commercial districts.
- Community and neighborhood organizations advocating for safer, more walkable communities.
- Universities and researchers conducting studies on urban planning, public health, or transportation.
- Students learning GIS, urban planning, and spatial analysis techniques.
- Developers and real estate professionals interested in understanding neighborhood accessibility and location characteristics.
References
- (2018, June 17). Urban sprawl triples public service costs, says OECD. Cities Today. https://cities-today.com/urban-sprawl-triples-public-service-costs-says-oecd/
- America Walks. (n.d.). Walkable Land Use. America Walks Resources. Retrieved https://americawalks.org/resources/walkable-land-use/?
- Brewer, C. A., & Pickle, L. (2002). Evaluation of Methods for Classifying Epidemiological Data on Choropleth Maps in Series. Annals of the Association of American Geographers, 92(4), 662–681.
- Duany, A., & Plater-Zyberk, E. (1992). The Second Coming of the American Small Town. The Wilson Quarterly, 16(1), 19–50.
- Jenks, G. F., & Caspall, F. C. (1971). Error on Choroplethic Maps: Definition, Measurement, Reduction. Annals of the Association of American Geographers, 61(2), 217–244.
- McGinn, M. (2025, September 18). How Many Americans Live in Walkable Neighborhoods? Streetsblog USA. https://usa.streetsblog.org/2025/09/18/how-many-americans-live-in-walkable-neighborhoods
- Pinski, M., & McCarthy, L. N. (2023, April 12). Opinion: Surprised by Your Neighborhood’s Walkability Score? Don’t Be. https://www.planetizen.com/features/122592-opinion-surprised-your-neighborhoods-walkability-score-dont-be
- QGIS Project. (n.d.). The Vector Properties Dialog. QGIS Documentation. Retrieved September 14, 2026, from https://docs.qgis.org/3.10/en/docs/user_manual/working_with_vector/vector_properties.html
- Environmental Protection Agency. (2021a). National Walkability Index: Methodology and User Guide. U.S. Environmental Protection Agency (EPA). https://www.epa.gov/smartgrowth/smart-location-mapping#walkability
- Environmental Protection Agency. (2021b). Smart Location Database (SLD) 3.0: Technical Documentation and User Guide. U.S. Environmental Protection Agency. https://www.epa.gov/smartgrowth/smart-location-mapping#SLD
- Smith, R. M. (1986). Comparing Traditional Methods for Selecting Class Intervals on Choropleth Maps. The Professional Geographer, 38(1), 62–67.
- Steuteville, R. (2016, September 30). Comparing Neighborhood and Sprawl. Public Square (Congress for the New Urbanism). https://www.cnu.org/publicsquare/2016/09/30/comparing-neighborhood-and-sprawl
- Steuteville, R. (2019, January 10). Walkability Indexes Are Flawed—Let’s Find Better Methods. Public Square (Congress for the New Urbanism). https://www.cnu.org/publicsquare/2019/01/10/walkability-indexes-are-flawed-lets-find-better-method1
- Watson, K. B., Whitfield, G. P., Thomas, J. V., Berrigan, D., Fulton, J. E., & Carlson, S. A. (2020). Associations between the National Walkability Index and walking among US Adults—National Health Interview Survey, 2015. Preventive Medicine, 137, 106122. https://doi.org/10.1016/j.ypmed.2020.106122