Neighborhood Walkability Explorer
People experience walkability at the neighborhood level—not through citywide averages. Sidewalks, street networks, transit access, nearby destinations, and land-use patterns all vary considerably within the same city. Understanding these neighborhood differences provides a more meaningful picture of how communities support walking and everyday accessibility.
The American Walkability Atlas measures neighborhood walkability across dozens of U.S. cities using GIS-based spatial analysis and the EPA National Walkability Index. Explore interactive maps, compare neighborhoods across cities, and discover how urban form shapes walkability within metropolitan areas.
Kevin Lynch's Concept of Neighborhoods
Throughout the Atlas, neighborhoods are interpreted using Kevin Lynch’s broader concept of districts rather than simply residential subdivisions. In The Image of the City (1960), Lynch identified districts as one of the five elements people use to understand and navigate cities, alongside paths, edges, nodes, and landmarks.
“Relatively large city areas which the observer can mentally go inside of, and which have some common character…the characteristics that determine districts are thematic continuities which may consist of an endless variety of components.”
— Kevin Lynch, The Image of the City (1960)
This perspective recognizes neighborhoods as places defined by shared physical, social, and functional characteristics rather than by administrative boundaries alone.
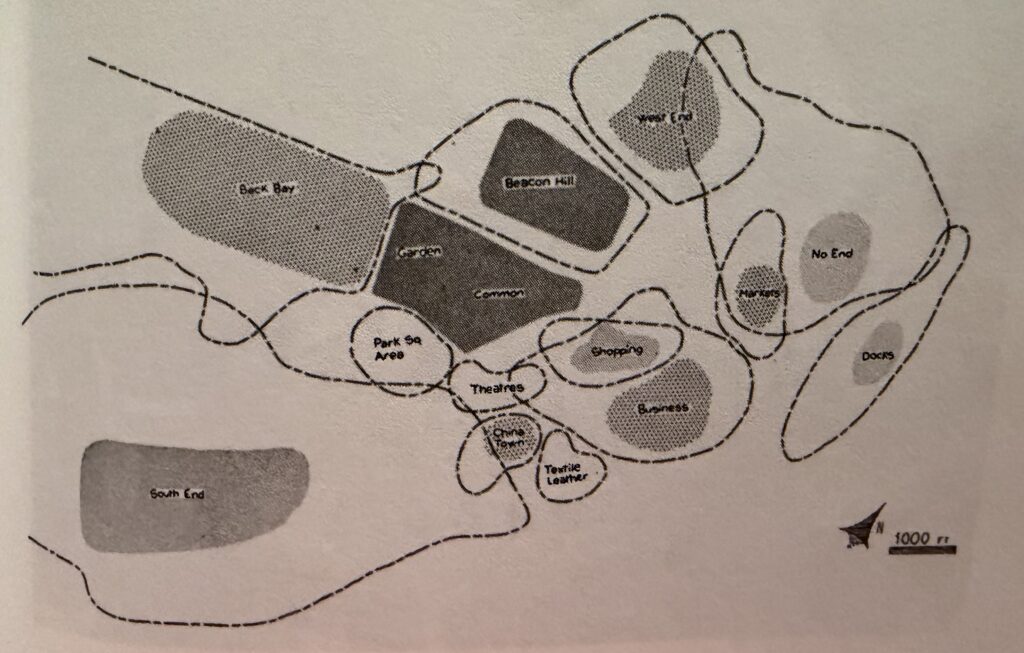
The image above depicts Kevin Lynch’s conceptualization of urban districts in Boston, as presented in The Image of the City (1960, p. 69).
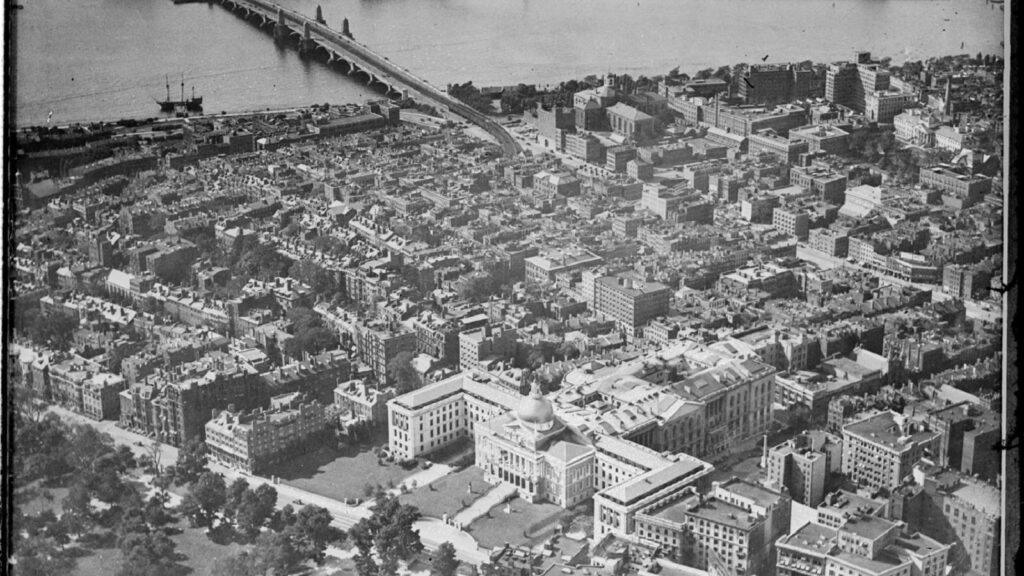
Beacon Hill, Boston demonstrates many characteristics associated with highly walkable neighborhoods, including a connected street network, compact development, and a mix of land uses. Photo courtesy of the U.S. National Park Service (Beacon Hill, n.d.).
Quick Statistics
2,740
Neighborhoods Analyzed
80
Cities Represented
13.34
Average National Walkability Index
As of right now I have neighborhood level interactive maps for the following cities. Published means it is available to view while In Progress means its still being worked on:
How to Read This Map
The colors on this map represent the EPA National Walkability Index, which measures how supportive a neighborhood’s built environment is for walking. Higher scores generally indicate greater street connectivity, a more diverse mix of land uses, better access to destinations, and stronger transit accessibility (U.S. Environmental Protection Agency, 2021b, 2021a).
| Score | Walkability | What It Means |
| 1.000–2.857 | Very Low Walkability | Very low relative walkability, generally reflecting weak performance across the built-environment characteristics associated with walking. |
| 2.857–5.714 | Low Walkability | Low relative walkability, with built-environment conditions generally providing limited support for walking as a mode of transportation. |
| 5.714–8.571 | Below Average Walkability | Below-average relative walkability, with some characteristics supportive of walking but generally weaker connectivity, land-use mix, or transit proximity. |
| 8.571–11.429 | Moderate Walkability | Moderate relative walkability, representing a middle range of built-environment conditions associated with walking. |
| 11.429–14.286 | Above Average Walkability | Above-average relative walkability, with stronger combinations of street connectivity, land-use diversity, and/or transit proximity. |
| 14.286–17.143 | High Walkability | High relative walkability, where built-environment characteristics provide substantial support for walking as a transportation option. |
| 17.143–20.000 | Very High Walkability | Very high relative walkability, representing some of the strongest combinations of built-environment characteristics associated with walking. |
Important: The National Walkability Index is a relative measure. Scores compare neighborhoods across the United States and are based on characteristics such as intersection density, land-use diversity, residential and employment density, transit accessibility, and access to destinations. A higher score indicates a built environment that is generally more supportive of walking, but it does not measure sidewalk quality, safety, crime, aesthetics, or local pedestrian conditions (U.S. Environmental Protection Agency, 2021b).
Variables of the National Walkability Index- Neighborhood Level
Neighborhood Intersection Density
Compare street connectivity across neighborhoods to identify highly connected areas that support safer and more direct pedestrian travel.
Neighborhood Transit Accessibility
Evaluate neighborhood access to nearby transit stops and identify communities with stronger connections to public transportation.
Neighborhood Employment Mix
Analyze how employment opportunities are distributed within neighborhoods and how local land uses support walkability.
Neighborhood Jobs & Housing Mix
Measure the balance between employment and residential development within neighborhoods to better understand mixed-use environments.
Further Reading

At the pedestrian level, Beacon Hill’s narrow streets, human-scale buildings, and continuous street walls create an environment that encourages walking. Photo courtesy of (“Beacon Hill, Boston,” 2026)
Key Takeaways
- Most neighborhoods are moderately to highly walkable. Approximately 85% of neighborhoods fall within the Above Average Walkability, High Walkability, or Very High Walkability categories, indicating that much of the built environment provides at least moderate support for walking and access to everyday destinations.
- Walkability varies significantly within the same municipality. Neighborhood-level analysis reveals substantial differences that municipal averages often conceal. Many cities contain highly walkable downtowns and mixed-use districts alongside lower-scoring suburban or specialized neighborhoods, highlighting the importance of evaluating walkability at a finer geographic scale.
- The highest walkability scores are concentrated in compact urban centers. Downtown districts, historic neighborhoods, transit-oriented developments, university areas, and mixed-use commercial corridors consistently achieve the highest National Walkability Index scores because they combine connected street networks, diverse land uses, nearby destinations, and strong transit access.
- Lower scores are generally associated with dispersed or specialized land uses. Neighborhoods characterized by low-density suburban development, disconnected street networks, industrial areas, airports, large parks, reservoirs, or other special-purpose land uses tend to receive lower walkability scores due to fewer nearby destinations and reduced street connectivity.
- Neighborhood walkability provides valuable guidance for planning and investment. Because the National Walkability Index identifies where the built environment already supports walking—and where improvements may be most beneficial—it serves as an effective planning tool for prioritizing investments in street connectivity, mixed-use development, pedestrian infrastructure, and transit accessibility while recognizing that local conditions should always be confirmed through field observations and community engagement.
Methodology
Neighborhood scores are calculated by aggregating EPA National Walkability Index values for Census block groups within Neighborhood boundaries. This provides a consistent basis for comparing walkability across communities nationwide.
Distribution of EPA National Walkability Index Scores
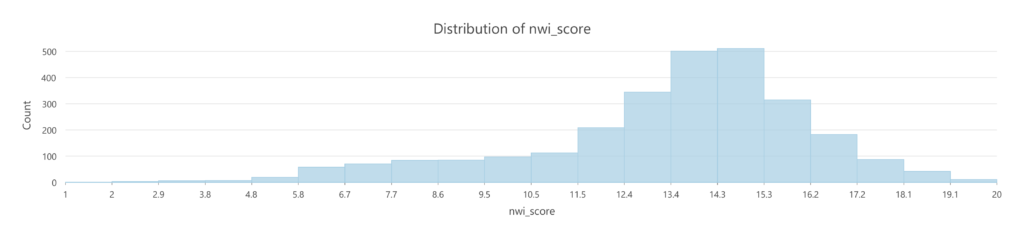
Distribution of EPA National Walkability Index Scores for U.S. Neighborhoods:
- Sample size (2,740 Neighborhoods)
- Mean = 13.34
- Median = 13.93
- Min = 1
- Max = 20
- SD = 2.87
Neighborhood Walkability Analysis
Classification Categories
The American Walkability Atlas classifies neighborhoods into seven walkability categories based on National Walkability Index scores. The categories provide additional detail beyond the EPA’s four broad classifications while maintaining the same underlying National Walkability Index methodology. They describe how the built environment supports walking through the combined effects of street connectivity, transit accessibility, employment diversity, and the mix of jobs and households. The National Walkability Index itself is calculated using these four variables developed by the U.S. Environmental Protection Agency. Research has consistently shown that neighborhoods combining connected street networks with mixed land uses and accessible destinations encourage greater walking, improve accessibility, and support healthier travel behavior (Cervero & Kockelman, 1997; Ewing & Cervero, 2010; Frank et al., 2005)
- Very High Walkability (17.143–20.000): Compact, mixed-use neighborhoods with highly connected street networks, abundant destinations, and excellent transit access where walking is a practical choice for many daily trips. These neighborhoods typically contain downtown districts, historic urban centers, or major mixed-use activity centers.
- High Walkability (14.286–17.143): Well-connected neighborhoods with diverse land uses, strong street connectivity, and convenient access to employment, shopping, parks, schools, and transit. Walking is practical for many everyday activities, although some trips may still require driving or transit.
- Above Average Walkability (11.429–14.286): Balanced neighborhoods where walking and driving both play important roles. Residents generally have reasonable access to everyday destinations through moderately connected street networks and a mix of residential and commercial development, although destinations may be more dispersed than in highly walkable areas.
- Moderate Walkability (8.571–11.429): Neighborhoods where walking is practical for nearby destinations but automobile travel becomes increasingly necessary for longer trips. These areas often combine older walkable sections with newer suburban development, lower intersection density, or reduced transit accessibility.
- Below Average Walkability (5.714–8.571): Predominantly suburban neighborhoods characterized by separated land uses, limited destination diversity, lower street connectivity, and greater dependence on automobiles. Walking is generally limited to recreation or short neighborhood trips.
- Low Walkability (2.857–5.714): Low-density neighborhoods with disconnected street networks, limited nearby destinations, and minimal transit access. Most daily activities require driving because employment, shopping, and services are located relatively far from residential areas.
- Very Low Walkability (1.000–2.857): Rural areas, large undeveloped landscapes, airport districts, industrial areas, parks, or highly dispersed suburban neighborhoods where the built environment provides very little support for walking. These locations typically have very low street connectivity, few destinations, and limited pedestrian infrastructure.
Planning Implications
The National Walkability Index provides planners with a valuable screening tool for evaluating how neighborhood design supports walking and access to daily destinations. Because the index combines street connectivity, transit accessibility, employment diversity, and the balance between jobs and housing, it helps identify neighborhoods where the built environment already supports walking and those where targeted improvements may be needed. The EPA developed the index specifically to support land-use planning, transportation planning, public health initiatives, and scenario analysis by providing a consistent nationwide measure of neighborhood walkability.
Neighborhoods classified as Very High or High Walkability typically represent established urban centers, historic neighborhoods, transit-oriented developments, or mixed-use districts where planning efforts should focus on preserving pedestrian infrastructure, maintaining transit service, encouraging infill development, and protecting neighborhood accessibility. These areas often serve as models for future walkable development while also requiring strategies to address housing affordability and displacement pressures associated with highly desirable walkable environments.
Neighborhoods within the Above Average and Moderate Walkability categories often present the greatest opportunity for incremental improvements. Investments such as new pedestrian crossings, sidewalk gap closures, bicycle infrastructure, transit enhancements, mixed-use redevelopment, and improved street connectivity can substantially increase walkability without requiring major redevelopment. Research by Cervero and Kockelman (1997) demonstrates that improving density, land-use diversity, and street design can significantly influence travel behavior, while Frank et al. (2005) found that neighborhoods combining connected streets with mixed land uses encourage higher levels of walking and physical activity.
For neighborhoods classified as Below Average, Low, or Very Low Walkability, long-term planning strategies may focus on improving connectivity, increasing destination diversity, expanding transit service, encouraging mixed-use development, and reducing automobile dependence where appropriate. However, planners should recognize that some low-scoring neighborhoods consist primarily of airports, industrial districts, large parks, protected natural areas, or rural landscapes where limited walkability reflects intended land uses rather than deficiencies in community design.
Overall, the National Walkability Index should be used alongside local knowledge, field observations, pedestrian infrastructure inventories, safety analyses, accessibility audits, and community engagement. While the index effectively measures characteristics of the built environment, it does not directly evaluate sidewalk quality, lighting, traffic speeds, crime, shade, topography, or other factors that influence the pedestrian experience.
Understanding Neighborhood Walkability
Neighborhood walkability reflects the degree to which residents can safely and conveniently reach everyday destinations on foot. Unlike municipal-level analyses, neighborhood-level measurements reveal localized differences in the built environment that are often hidden when entire cities are evaluated using a single average score.
The National Walkability Index measures four characteristics that research has consistently linked to walking behavior:
- Intersection Density, representing street network connectivity.
- Proximity to Transit Stops, measuring access to public transportation.
- Employment Mix, reflecting the diversity of employment opportunities.
- Employment and Household Mix, representing the balance between jobs and residential development.
Together, these variables estimate how supportive a neighborhood’s built environment is for walking. Numerous studies within the urban planning literature—including Cervero and Kockelman (1997), Ewing and Cervero (2010), and Frank et al. (2005)—have found that neighborhoods combining connected street networks, diverse land uses, and nearby destinations consistently generate more walking than neighborhoods characterized by disconnected streets and single-use development.
It is important to recognize that the National Walkability Index measures potential walkability rather than the quality of the pedestrian experience itself. Two neighborhoods with similar scores may differ substantially in sidewalk conditions, street trees, lighting, traffic safety, ADA accessibility, or perceived personal safety. Consequently, the index should be viewed as a planning indicator rather than a complete assessment of pedestrian conditions.
Perhaps the greatest strength of neighborhood-level analysis is its ability to identify variation within cities. Downtown districts, historic neighborhoods, university areas, and transit corridors frequently receive substantially higher scores than suburban neighborhoods located only a few miles away. This level of detail helps planners prioritize investments where improvements are likely to produce the greatest increases in accessibility and mobility.
Geographic Patterns in Neighborhood Walkability
Across the 2,740 neighborhoods analyzed, National Walkability Index (NWI) scores range from 1.00 to 20.00, with an overall mean of approximately 13.34 and a median of approximately 13.93. Using the seven fixed intervals applied in this analysis, the greatest concentrations occur between 11.43–14.29 (1,049 neighborhoods) and 14.29–17.14 (1,014 neighborhoods). Together, these two categories contain 2,063 neighborhoods, or approximately 75.3 percent of all neighborhoods, demonstrating that the study area is dominated by places with moderate-to-relatively-high support for walking rather than by either extreme.
This concentration is consistent with the structure of the EPA National Walkability Index. The NWI does not measure sidewalks or pedestrian conditions directly; instead, it evaluates characteristics of the built environment associated with the likelihood of walking. Specifically, the index incorporates street intersection density, proximity to transit, employment mix, and employment-and-household mix. Higher intersection density, shorter distances to transit, and greater diversity of land uses are associated with greater support for walking. The Smart Location Database similarly organizes the built environment around density, diversity, design, transit accessibility, and destination accessibility, reflecting the broader planning literature concerning the relationship between urban form and travel behavior.
The highest-scoring neighborhoods are disproportionately associated with downtowns, historic districts, compact mixed-use centers, and other highly connected urban environments. Examples include Charlottesville Historic District–Starr Hill (20.00), Denver Civic Center (19.67), Minneapolis Nicollet Island–East Bank (19.67), Eugene Downtown (19.58), Philadelphia Center City East (19.33), Philadelphia Old City (19.08), and San Francisco Chinatown (19.17). The pattern closely resembles EPA’s city-center example, where high intersection density, strong transit proximity, and mixed uses produce a NWI score of 17.5.
Downtowns are particularly revealing. Among the 52 neighborhoods containing “Downtown” in their names, the average NWI score is approximately 15.64, considerably higher than the dataset-wide average of 13.34. However, downtown status does not automatically produce high walkability. Downtown Waco scores only 8.71, while Downtown Gary scores 9.88, demonstrating that the functional characteristics captured by the EPA variables matter more than the neighborhood label itself. A downtown with limited transit accessibility, weaker land-use diversity, or lower street connectivity can therefore score substantially below a compact, transit-rich downtown.
A general center-to-edge pattern remains visible in many cities, but the data suggest that it should be described as a tendency rather than a universal rule. Compact central neighborhoods frequently outperform peripheral, low-density, or specialized areas because traditional urban centers tend to combine connected street networks, multiple destinations, employment, housing, and transit. EPA’s own examples progress from a low-scoring rural environment, through suburban residential development, to a historic main street and finally a city/suburban town center, illustrating how differences in built form correspond to increasing NWI values. EPA’s suburban example further demonstrates that a neighborhood can possess adequate pedestrian infrastructure yet receive a relatively low NWI score when transit accessibility and land-use mix are weak.
At the lower end of the distribution, specialized or sparsely developed landscapes appear prominently. Examples include New York City’s Jamaica Bay (West) (1.00), Los Angeles’ Chatsworth Reservoir (2.00), Jamaica Bay (East) (2.00), Boston’s Harbor Islands (2.67), Riverside’s Sycamore Canyon Park (3.00), Stockton’s Mariposa Lakes (3.00), and New Orleans’ Lake Catherine (3.67). These results require careful interpretation. Low NWI values in reservoirs, islands, parks, open spaces, airports, industrial districts, and similar environments do not necessarily represent planning failures. Instead, many such areas lack the mixture of residences, employment, connected streets, and transit accessibility that the NWI is specifically designed to reward. EPA similarly notes that rural areas can score poorly because destinations are dispersed, street networks are spread out, and transit access is absent.
The data also demonstrate substantial variation within individual municipalities, reinforcing the importance of neighborhood-scale analysis. New York City ranges from 1.00 to 17.22, Los Angeles from 2.00 to 17.40, Pittsburgh from 3.83 to 18.94, New Orleans from 3.67 to 18.67, and Boston from 2.67 to 17.61. These enormous internal ranges demonstrate that a single citywide walkability value can conceal fundamentally different built environments. This neighborhood-scale approach is particularly compatible with the EPA methodology because the original NWI is calculated for Census block groups rather than entire municipalities, providing a nationwide framework for comparing relatively small geographic units.
Overall Pattern
Taken as a whole, the results show that neighborhood walkability exists along a broad continuum, but the distribution in this dataset is strongly concentrated toward the center and upper-middle portions of the NWI scale. Of the 2,740 neighborhoods, 4 fall between 0–2.86, 30 between 2.86–5.71, and 209 between 5.71–8.57. By comparison, 295 fall between 8.57–11.43, 1,049 between 11.43–14.29, 1,014 between 14.29–17.14, and 139 between 17.14–20.00. Thus, extremely low and extremely high scores are comparatively uncommon, while intermediate and moderately high values dominate the dataset.
The concentration is particularly pronounced in the two largest categories. The 1,049 neighborhoods in the 11.43–14.29 interval represent approximately 38.3 percent of the dataset, while the 1,014 neighborhoods in the 14.29–17.14 interval account for approximately 37.0 percent. Combined, these 2,063 neighborhoods represent approximately 75.3 percent of all 2,740 neighborhoods analyzed. By contrast, only 243 neighborhoods, or approximately 8.9 percent, have NWI scores below 8.57, while 139 neighborhoods, or approximately 5.1 percent, occupy the highest interval of 17.14–20.00.
This distribution should not be interpreted as a direct measurement of how much people actually walk. EPA defines the NWI as a measure of relative walkability based on built-environment characteristics affecting the likelihood or feasibility of walking for utilitarian transportation. The component variables are ranked relative to other Census block groups, and the final index ranges from 1 to 20. Consequently, a neighborhood’s score indicates how strongly its built environment supports walking according to the EPA methodology rather than providing a direct measure of pedestrian activity, sidewalk quality, pedestrian comfort, or resident travel behavior.
The geographic results nevertheless show a clear relationship between urban structure and relative walkability. The strongest scores generally occur where several supportive characteristics coincide: connected street networks, diverse land uses, concentrations of housing and employment, and access to transit. Conversely, the lowest values tend to occur where one or more of these elements are absent, particularly in geographically isolated, undeveloped, automobile-oriented, or specialized-use environments. This finding closely follows the logic of the EPA methodology, which combines land-use diversity, street connectivity, and transit access into a composite measure of the built environment’s support for walking.
The results also demonstrate that walkability is more accurately understood as a neighborhood-scale characteristic than as a uniform municipal characteristic. A city can simultaneously contain some of the most and least walkable environments in the dataset. The extreme internal variation found in New York City, Los Angeles, Boston, Pittsburgh, and New Orleans illustrates how municipal boundaries encompass downtowns, traditional residential neighborhoods, suburban districts, industrial areas, parks, airports, waterways, and other land uses with fundamentally different spatial characteristics. Citywide averages therefore provide useful summaries but can obscure the geography that actually produces walkability.
Finally, the seven-class analysis adds an important distinction to the EPA’s original four-category classification. EPA officially divides NWI scores into Least Walkable (1–5.75), Below Average Walkable (5.76–10.5), Above Average Walkable (10.51–15.25), and Most Walkable (15.26–20). The seven equal intervals used in this analysis provide greater analytical resolution within that 1–20 continuum, making differences between neighborhoods more visible. They should therefore be presented as analytical subclasses derived from the EPA index, rather than as replacements for EPA’s official categories.
Overall, the results reinforce the central premise of the National Walkability Index: walkability emerges from the interaction of multiple characteristics of the built environment rather than from any single feature. Compact urban centers frequently perform well because connectivity, land-use diversity, employment, housing, and transit reinforce one another, while dispersed or specialized landscapes generally perform less strongly. At the same time, the substantial variation both between and within cities demonstrates why neighborhood-scale GIS analysis is particularly valuable. It reveals spatial differences that municipal averages cannot capture and provides planners with a more precise basis for identifying where changes to connectivity, land-use patterns, and transit accessibility may strengthen the built environment’s support for walking.
Defining Neighborhood Boundaries
A common question is, “What counts as a neighborhood?” Neighborhood boundaries in this atlas are derived from a combination of municipal GIS datasets, local planning departments, Census-designated neighborhoods, and, where no official boundaries exist, carefully developed custom boundaries.
Some cities, such as Los Angeles, Chicago, and Boston, provide readily available neighborhood shapefiles. Others, including Dallas, require interpretation because neighborhood boundaries are often subjective, overlapping, or organized hierarchically. For example, larger districts such as Northeast Dallas encompass smaller, distinct neighborhoods like Deep Ellum, Bryan Place, and Lower Greenville. Likewise, Downtown Dallas can be subdivided into eight recognized districts, including the Arts District, West End Historic District, and Farmers Market District.
Users may also notice that neighborhood analyses are available for Dallas, Arlington, and Irving, but not Fort Worth. At present, Fort Worth has not been evaluated at the neighborhood scale because many of its neighborhoods are too small to be meaningfully analyzed using Census block group data. Although Census blocks offer greater spatial precision, their small size introduces additional methodological challenges and reduces the consistency of comparisons across cities.
This issue is not unique to Fort Worth. Similar challenges have been encountered in neighborhoods such as Wolfe Park (Columbus); Freshkills Park, Sunnyside Yards, North and South Brother Islands, and Woodlawn Cemetery (New York City); Sunshine Gardens and Maywood (Indianapolis); Arcadia Heights (Salt Lake City); Industrial Corridor (Eugene); Yerba Buena Island, Produce Market, and Apparel City (San Francisco); Ballena Bay, East Shore, and Marina (Alameda); and East Elliott, Rancho Encantada, Torrey Hills, Los Peñasquitos Canyon, Fairbanks Ranch Country Club, and Via de la Valle (San Diego).
As higher-resolution and more consistent datasets become available, neighborhood-level analyses will be expanded to include these areas.
How Neighborhood Scores Are Calculated
Think of Census block groups as the building blocks of neighborhoods. Each neighborhood is made up of several block groups, and the walkability of those block groups is combined to produce a neighborhood-level score:
Entire City
│
├── Downtown
│ ├── Block Group A
│ ├── Block Group B
│ └── Block Group C
│
├── Midtown
│ ├── Block Group D
│ └── Block Group E
│
└── Uptown
├── Block Group F
└── Block Group G
Limitations
The National Walkability Index provides a standardized measure for comparing neighborhood walkability across the United States. However, the EPA notes that the index should be interpreted alongside other information about the built environment and local context (U.S. Environmental Protection Agency, 2021b).
Measures Relative Walkability
The National Walkability Index ranks Census block groups using national percentile scores rather than assigning an absolute measure of walkability. A higher score indicates that a neighborhood is generally more supportive of walking compared with other block groups nationwide, but it does not guarantee that every street or destination within the neighborhood provides a high-quality pedestrian experience.
Limited to Four Built Environment Indicators
The EPA constructed the National Walkability Index using four measures:
- Intersection density
- Proximity to transit
- Employment mix
- Employment and household mix
Although these indicators capture important characteristics associated with walkability, they do not represent every factor that influences whether people choose to walk.
Does Not Measure Pedestrian Infrastructure Quality
The National Walkability Index does not evaluate the condition or quality of sidewalks, crosswalks, curb ramps, lighting, street trees, traffic speeds, or other streetscape features that influence pedestrian comfort and safety. Instead, it relies on nationally consistent datasets describing street connectivity, land-use patterns, and transit accessibility.
Based on Census Block Groups
The EPA calculates the National Walkability Index at the Census block group level. As a result, neighborhoods are represented by a single composite score that summarizes overall conditions within each block group. Local variation within a neighborhood or destinations located immediately outside block-group boundaries may not be fully reflected in the index.
Not a Measure of Individual Walking Behavior
The National Walkability Index estimates how supportive the built environment is for walking, but it does not measure how much people actually walk. Walking behavior is influenced by many additional factors, including personal preferences, demographics, weather, health, safety perceptions, and local travel patterns, which are outside the scope of the index.
Key Takeaway
The National Walkability Index is a valuable tool for comparing neighborhood walkability using a nationally consistent methodology. However, it should be interpreted as a screening and comparison tool rather than a complete assessment of the pedestrian environment. For the most comprehensive understanding of neighborhood walkability, the EPA recommends considering the National Walkability Index alongside its component indicators—intersection density, employment mix, employment-household mix, and transit proximity—as well as local knowledge of pedestrian infrastructure and community conditions.
References
- Beacon Hill, Boston. (2026). In Wikipedia. https://en.wikipedia.org/w/index.php?title=Beacon_Hill,_Boston&oldid=1363755946
- Beacon Hill (U.S. National Park Service). (n.d.). Retrieved August 3, 2026, from https://www.nps.gov/places/beacon-hill.htm
- Cervero, R., & Kockelman, K. (1997). Travel demand and the 3Ds: Density, diversity, and design. Transportation Research Part D: Transport and Environment, 2(3), 199–219. https://doi.org/10.1016/S1361-9209(97)00009-6
- Ewing, R., & Cervero, R. (2010). Travel and the Built Environment: A Meta-Analysis. Journal of the American Planning Association, 76(3), 265–294. https://doi.org/10.1080/01944361003766766
- Frank, L. D., Schmid, T. L., Sallis, J. F., Chapman, J., & Saelens, B. E. (2005). Linking objectively measured physical activity with objectively measured urban form. American Journal of Preventive Medicine, 28(2), 117–125. https://doi.org/10.1016/j.amepre.2004.11.001
- Lynch, K. (1960). The Image of the City. MIT Press.
- S. Environmental Protection Agency. (2021a). National Walkability Index: Methodology and User Guide. U.S. Environmental Protection Agency (EPA). https://www.epa.gov/smartgrowth/smart-location-mapping#walkability
- U.S. Environmental Protection Agency. (2021b). Smart Location Database (SLD) 3.0: Technical Documentation and User Guide. U.S. Environmental Protection Agency. https://www.epa.gov/smartgrowth/smart-location-mapping#SLD