Walkability Across America's Municipalities
Explore how more than 6,000 U.S. municipalities compare using the EPA National Walkability Index. Use the interactive maps to identify national patterns, compare communities, and examine how street connectivity, transit access, employment diversity, and land-use balance shape walkability.
Quick Statistics
6,255
Municipalities Analyzed
9.62
Average Walkability Score
1.83–19.17
Score Range
Why Municipalities?
Municipal governments make many of the planning and transportation decisions that shape walkability. Comparing municipalities provides a useful benchmark for understanding how communities differ while recognizing that neighborhood conditions can vary within each city.
What is a Municipality?
A municipality is a city, town, village, or other incorporated local government with defined boundaries and planning authority. Municipal governments are responsible for many decisions that influence walkability, including land use, zoning, transportation infrastructure, and public space.
The American Walkability Atlas uses municipalities as its primary unit of analysis because they provide a practical and familiar way to compare walkability across communities throughout the United States.
National Walkability Index Interactive Maps
The National Walkability Index is scored on a scale from 1 to 20.
Equation: (w/3) + (x/3) + (y/6) + (z/6)
Where w = ranked score for intersection density
x = ranked score for proximity to transit stops
y = ranked score for employment mix
z = ranked score for employment and household mix
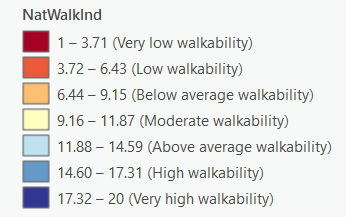
Variables of the National Walkability Index-Municipality Level
Municipal Intersection Density
Analyze street network connectivity by measuring intersection density across municipalities to understand how street design influences walkability.
Municipal Transit Accessibility
Evaluate municipal access to public transportation by measuring proximity to transit stops and identifying areas with stronger multimodal connectivity.
Municipal Employment Mix
Examine the diversity and concentration of employment opportunities across municipalities to better understand land use and economic activity.
Municipal Jobs & Housing Mix
Measure the relationship between employment and household distribution to evaluate land use balance and support planning decisions.
Further Research
Key Takeaways
- Municipal walkability varies substantially across the United States.
National Walkability Index (NWI) scores range from 1 to 19.17, with an average municipal score of 9.62, demonstrating considerable differences in the built environment from one municipality to another. These findings highlight the diversity of development patterns across American communities. - Most municipalities exhibit moderate levels of walkability.
While a relatively small number of municipalities achieve very high walkability scores, the majority cluster around the national average, suggesting that many communities provide some pedestrian accessibility but still have opportunities to improve connectivity, land-use mix, and access to everyday destinations. - Walkability is not distributed evenly across regions.
Municipalities in older, more urbanized regions generally tend to exhibit higher walkability scores than many automobile-oriented communities, although significant variation exists within every Census region, state, and metropolitan area. - Municipal averages provide a useful benchmark but should be interpreted with caution.
Each score represents an average across an entire municipality and may conceal important neighborhood-level differences. A municipality with a moderate overall score may still contain highly walkable districts alongside areas that are heavily automobile dependent. - Municipal walkability can support planning and policy decisions.
Comparing municipal walkability scores helps planners, researchers, and local governments identify communities that may benefit from investments in pedestrian infrastructure, improved street connectivity, mixed-use development, and multimodal transportation while also highlighting municipalities that can serve as examples of successful walkable urban form.
Methodology
Municipal scores are calculated by aggregating EPA National Walkability Index values for Census block groups within municipal boundaries. This provides a consistent basis for comparing walkability across communities nationwide.
Distribution of EPA National Walkability Index Scores
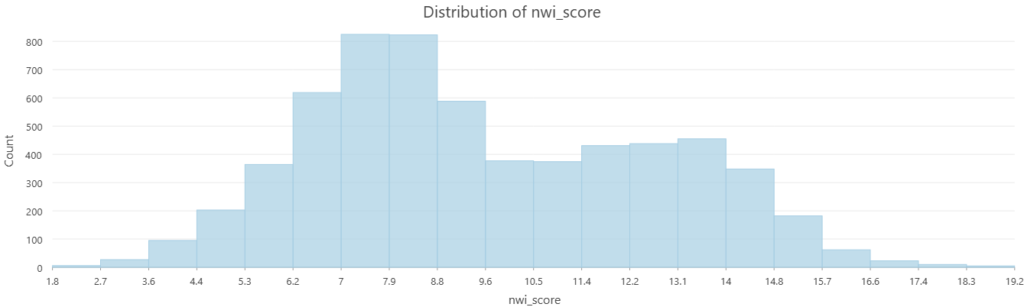
Distribution of EPA National Walkability Index Scores for U.S. Cities:
- Sample size (6,255 cities)
- Mean = 9.62
- Median = 8.95
- Min = 1.83
- Max = 19.17
- SD = 3.04
Municipal Walkability Analysis
The National Walkability Index classifies municipalities into seven categories, reflecting how well the built environment supports walking and access to everyday destinations.
- Very High Walkability (17.32–20.00): Compact, mixed-use communities with highly connected street networks and excellent transit access where walking is a practical mode of transportation.
- High Walkability (14.60–17.31): Well-connected municipalities with diverse land uses and strong pedestrian infrastructure that support many daily trips on foot.
- Above Average Walkability (11.88–14.59): Balanced communities where both walking and driving are viable, offering connected neighborhoods and convenient access to services and employment.
- Moderate Walkability (9.16–11.87): Communities combining older walkable neighborhoods with newer suburban development, where walking is practical locally but less convenient across the municipality.
- Below Average Walkability (6.44–9.15): Predominantly suburban environments with separated land uses and greater automobile dependence, limiting walking for everyday travel.
- Low Walkability (3.72–6.43): Low-density development with limited street connectivity and few nearby destinations, making most trips automobile dependent.
- Very Low Walkability (1.00–3.71): Rural or highly dispersed suburban communities where disconnected streets, single-use development, and limited pedestrian infrastructure provide little support for walking.
Planning Implications
Municipal walkability reflects how land-use planning, transportation infrastructure, and urban design influence accessibility. Higher-scoring municipalities generally provide (Cervero & Kockelman, 1997; Ewing & Cervero, 2010; U.S. Environmental Protection Agency, 2021):
- Better access to jobs, schools, parks, and services (Ewing & Cervero, 2010; Frank et al., 2006).
- More transportation choices beyond the automobile (Ewing & Cervero, 2010).
- Greater opportunities for active transportation and healthier lifestyles (Frank et al., 2006).
- More efficient land use and stronger commercial districts (Jacobs, 1961; Speck, 2022).
Lower-scoring municipalities may improve walkability by enhancing street connectivity, expanding pedestrian infrastructure, encouraging mixed-use development, improving transit access, and promoting infill development (Cervero & Kockelman, 1997).
Understanding Municipal Walkability
Municipal walkability scores provide a consistent way to evaluate how the built environment supports pedestrian accessibility (U.S. Environmental Protection Agency, 2021). By comparing municipalities nationwide, the American Walkability Atlas helps planners, local governments, researchers, and residents identify strengths, recognize opportunities for improvement, and better understand how planning decisions shape walkability.
Geographic Patterns in Municipal Walkability
Analysis of American Walkability Atlas data indicates walkability follows clear regional patterns that reflect differences in development history and urban form.
- Northeast Corridor: Municipalities from Boston to Washington, D.C. consistently exhibit the nation’s highest walkability due to compact development, connected street grids, and extensive transit systems (Hamidi & Ewing, 2014; Jacobs, 1961).
- Great Lakes and Upper Midwest: Older industrial cities such as Chicago, Minneapolis–St. Paul, Milwaukee, Cleveland, and Pittsburgh generally maintain above-average walkability through traditional neighborhood development.
- West Coast: Municipalities around San Francisco, Seattle, Portland, and parts of Southern California benefit from higher densities, mixed-use development, and expanding transit networks.
- Sun Belt: Many municipalities across Texas, Arizona, Nevada, and Florida display moderate to below-average walkability as a result of postwar suburban expansion and automobile-oriented development, although older downtowns often remain highly walkable (Hamidi & Ewing, 2014; Jackson, 1987).
- Rural Areas and Great Plains: Lower-density development and greater distances between destinations typically result in lower walkability scores.
Within metropolitan areas, a clear pattern also emerges: older central cities and inner-ring suburbs generally achieve higher walkability than newer suburban communities, where disconnected street networks and single-use development become more common (Cervero & Kockelman, 1997; Ewing & Cervero, 2010; Hamidi & Ewing, 2014; Speck, 2022).
Overall Pattern
Municipal walkability closely reflects the history of urban development in the United States. Older communities built before widespread automobile ownership generally achieve higher walkability through compact design, connected streets, and mixed land uses, while newer suburban municipalities tend to be more automobile dependent. Together, these patterns illustrate how planning decisions continue to shape pedestrian accessibility across the country (Jackson, 1987; Jacobs, 1961; Speck, 2022).
Concluding Remarks
Metropolitan-scale analysis reveals patterns that cannot be observed at the neighborhood level alone. By comparing walkability across entire urban regions, researchers and practitioners can better understand how transportation networks, land-use patterns, and development history influence pedestrian accessibility throughout the United States.
References
For Webpage
- Cervero, R., & Kockelman, K. (1997). Travel demand and the 3Ds: Density, diversity, and design. Transportation Research Part D: Transport and Environment, 2(3), 199–219. https://doi.org/10.1016/S1361-9209(97)00009-6
- Ewing, R., & Cervero, R. (2010). Travel and the Built Environment: A Meta-Analysis. Journal of the American Planning Association, 76(3), 265–294. https://doi.org/10.1080/01944361003766766
- Frank, L. D., Sallis, J. F., Conway, T. L., Chapman, J. E., Saelens, B. E., & Bachman, W. (2006). Many Pathways from Land Use to Health: Associations between Neighborhood Walkability and Active Transportation, Body Mass Index, and Air Quality. Journal of the American Planning Association, 72(1), 75–87. https://doi.org/10.1080/01944360608976725
- Hamidi, S., & Ewing, R. (2014). A longitudinal study of changes in urban sprawl between 2000 and 2010 in the United States. Landscape and Urban Planning, 128, 72–82. https://doi.org/10.1016/j.landurbplan.2014.04.021
- Jackson, K. (1987). Crabgrass Frontier: The Suburbanization of the United States. Oxford University Press.
- Jacobs, J. (1961). The Death and Life of Great American Cities(Reissue). Vintage.
- Office of Management and Budget. (2023). OMB Bulletin No. 23-01: Revised Delineations of Metropolitan Statistical Areas, Micropolitan Statistical Areas, and Combined Statistical Areas, and Guidance on Uses of the Delineations of These Areas (Bulletin OMB Bulletin No. 23-01; p. 183). Executive Office of the President, Office of Management and Budget. https://www.whitehouse.gov/wp-content/uploads/2023/07/OMB-Bulletin-23-01.pdf
- Speck, J. (2022). Walkable City: How Downtown Can Save America, One Step at a Time(Tenth Anniversary). Picador Paper.
- S. Environmental Protection Agency. (2021). National Walkability Index: Methodology and User Guide. U.S. Environmental Protection Agency (EPA). https://www.epa.gov/smartgrowth/smart-location-mapping#walkability
- S. Environmental Protection Agency. (2021). Smart Location Database (SLD) 3.0: Technical Documentation and User Guide. U.S. Environmental Protection Agency. https://www.epa.gov/smartgrowth/smart-location-database-technical-documentation-and-user-guide
For Variables
- S. Department of Housing and Urban Development, & Office of Policy Development & Research. (n.d). Pedestrian Connectivity (Healthy Communities Assessment Tool). U.S. Department of Housing and Urban Development (HUD). https://archives.huduser.gov/healthycommunities/indicator/18066.html
- S. Environmental Protection Agency. (2021). National Walkability Index: Methodology and User Guide. U.S. Environmental Protection Agency (EPA). https://www.epa.gov/smartgrowth/smart-location-mapping#walkability
- S. Environmental Protection Agency. (2021). Smart Location Database (SLD) 3.0: Technical Documentation and User Guide. U.S. Environmental Protection Agency. https://www.epa.gov/smartgrowth/smart-location-database-technical-documentation-and-user-guide
- S. Environmental Protection Agency. (2024, October 25). Smart Location Mapping. U.S. Environmental Protection Agency. https://www.epa.gov/smartgrowth/smart-location-mapping#SLD
- Watson, K. B., Whitfield, G. P., Thomas, J. V., Berrigan, D., Fulton, J. E., & Carlson, S. A. (2020). Associations between the National Walkability Index and walking among US Adults—National Health Interview Survey, 2015. Preventive Medicine, 137, 106122. https://doi.org/10.1016/j.ypmed.2020.106122