Service Area Analysis: Measuring Real-World Pedestrian Accessibility
Walkability is influenced not only by the distance between places, but also by the design and connectivity of the transportation network. Rather than assuming unrestricted straight-line movement, service area analysis estimates the area that can be reached on foot within a specified travel time by following actual streets, sidewalks, trails, and pedestrian connections while accounting for barriers such as dead ends, rivers, and railroads. As a result, network-based service areas provide a more realistic representation of pedestrian accessibility than traditional Euclidean buffers and have become a widely used approach in transportation planning, GIS, and accessibility research (Ewing & Cervero, 2010; Liao et al., 2020; Shashank & Schuurman, 2019).
This project uses network-based pedestrian analysis to estimate the areas that can be reached within 5-, 10-, and 15-minute walks from prominent locations across the United States. These travel-time thresholds are commonly used in accessibility and proximity-based planning because they represent practical walking distances for many daily activities and provide a useful framework for comparing pedestrian accessibility across communities (Carvalho et al., 2025; Elldér, 2024; Staricco, 2022).
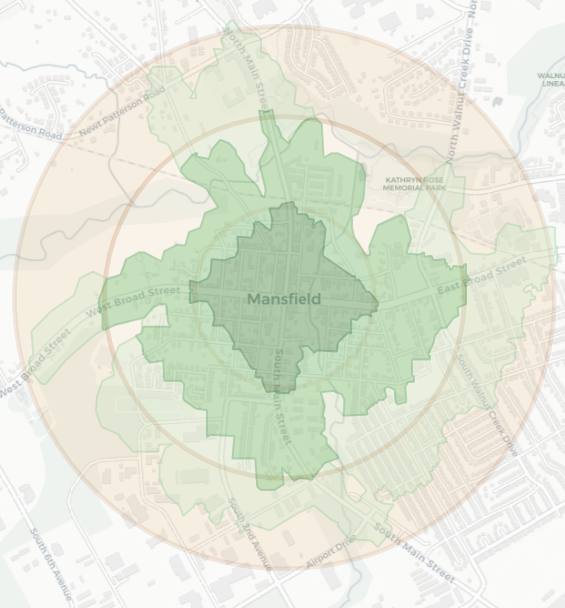
Straight-Line Buffer vs. Network Service Area
Straight-Line (Euclidean) Buffer | Network Service Area |
Measures straight-line distance | Follows the street and pedestrian network |
Assumes unrestricted movement | Accounts for connectivity and barriers |
Ignores the built environment | Represents realistic walking routes |
Useful for simple approximations | Produces more accurate accessibility estimates |
This can be seen with the diagram below with the Straight-Line Buffer in orange and the Network Service Area in green.
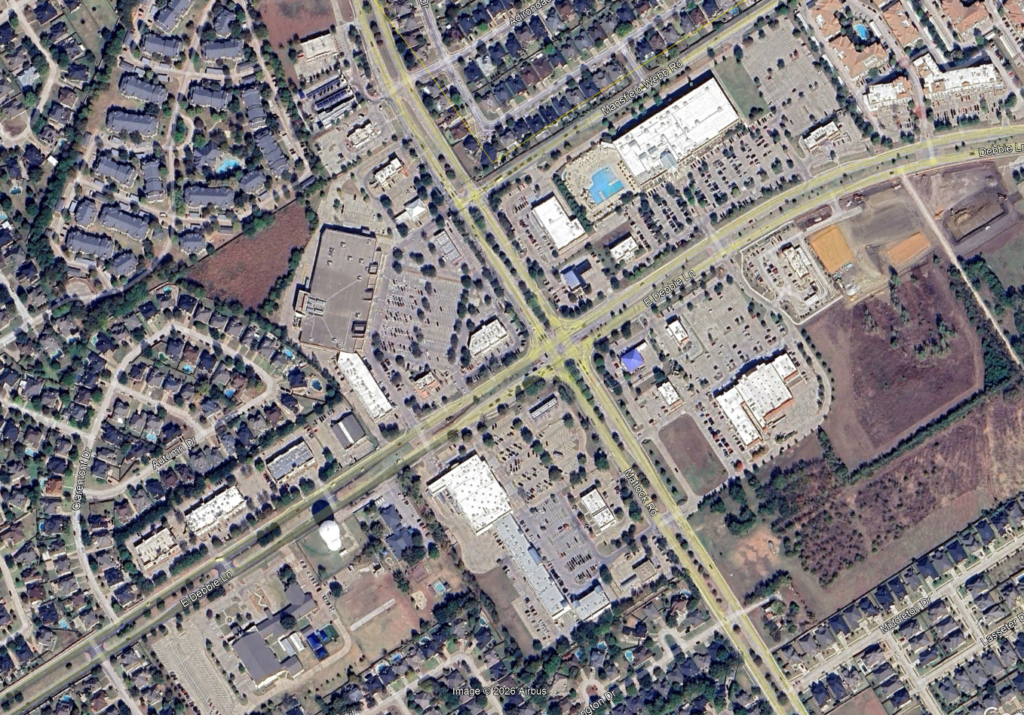
Adjacency does not equal accessibility. Although shopping and services are located nearby, wide roads, parking lots, walls, and other barriers often prevent direct pedestrian access (Duany et al., 2010). This Google Earth image shows the intersection of Debbie Lane and Matlock Road in Mansfield, Texas.
Explore the interactive maps below to see how street patterns, barriers, and urban form expand or restrict pedestrian movement across communities.
How to Use the Map
Select a municipality or featured location and turn the map layers on and off to compare:
- 5-minute walk: the immediate surroundings of the selected location
- 10-minute walk: a broader neighborhood-scale area
- 15-minute walk: the widest pedestrian service area included in the analysis
- Straight-line buffers: theoretical distances that do not account for the street network or physical barriers
The irregular shapes of the service areas reflect the routes available through the network. Areas with connected streets and multiple route choices may provide broader pedestrian reach, while barriers, dead ends, long blocks, and disconnected streets may limit the area that can be reached within the same amount of time (Elldér, 2024; Liao et al., 2020).
Notable Intersections:
For this section I will be looking at the most prominent nodes of the top 100 largest cities in America by population.
There are exceptions to this rule due to their impact on my life:
- Angel Fire, NM
- Brenham, TX
- Eagle Nest, NM
- Fredericksburg, TX
- Mansfield, TX
- Red River, NM
- San Angelo, TX
- San Marcos, TX
- Santa Fe, NM
- Taos, NM
There are other cities that are not in the top 100 that I have selected, but they were chosen because of nodes that are (at least in my opinion) impossible to ignore:
- Bay Lake, FL
- Bellevue, WA
- Bloomington, MN
- Cambridge, MA
- Coral Gables, FL
- Jacksonville Beach, FL
- Kendall, FL
- Miami Beach, FL
- Paradise, NV
- SeaTac, WA
- Summerlin South, NV
- Tempe, AZ
- Tigard, OR
- Towson, MD
- West Hollywood, CA
Population is based on the following sources: (U.S. Census Bureau, 2026c, 2026d, 2026a, 2026b, 2026e). Demographic characteristics were obtained from the U.S. Census Bureau QuickFacts database for Bay Lake, Florida; Coral Gables, Florida; Kendall CDP, Florida; Paradise CDP, Nevada; Summerlin South CDP, Nevada; and Towson CDP, Maryland (U.S. Census Bureau, n.d.)
Further Reading
Methodology
To evaluate pedestrian accessibility, I identified prominent nodes within each municipality and used ArcGIS Pro Network Analyst to generate 5-, 10-, and 15-minute walking service areas. Unlike circular buffers, these analyses calculate the streets and pedestrian routes that can actually be reached within a specified travel time, providing a realistic measure of network reachability (Rhoads et al., 2023; Weng et al., 2019; Zhang et al., 2023).
For comparison, I also generated straight-line (Euclidean) buffers at approximately 400, 800, and 1,200 meters, representing the theoretical distances a person could walk in 5, 10, and 15 minutes at an average walking speed of 5 km/h (3.1 mph). While these buffers provide a useful visual reference, they do not account for the street network or physical barriers and should not be interpreted as realistic measures of pedestrian accessibility (Radics et al., 2024; Wang et al., 2025).
Parameter | Description |
Software | ArcGIS Pro |
Analysis Tool | Network Analyst – Service Area |
Travel Mode | Walking |
Walking Speed | 5 km/h (3.1 mph) |
Time Breaks | 5, 10, and 15 minutes |
Comparison | 400, 800, and 1,200 m Euclidean buffers |
Output | Polygon service areas representing reachable locations |
Why 5-, 10-, and 15-Minute Walks?
Walking times of 5, 10, and 15 minutes have become widely used benchmarks because they approximate comfortable walking distances for many daily activities. These thresholds have been further popularized through the 15-minute city concept, which emphasizes access to essential destinations by walking, cycling, and public transportation rather than relying primarily on automobiles (Elldér, 2024; Marquet et al., 2024; Staricco, 2022). While traditional walkability indices evaluate the characteristics of neighborhoods, they do not show where people can actually travel along the pedestrian network. Service Area Analysis complements these measures by using ArcGIS Network Analyst to map the streets and sidewalks that can be reached within a specified walking time, providing a more realistic representation of how street connectivity, urban form, and physical barriers influence pedestrian accessibility (Ewing & Cervero, 2010; Liao et al., 2020; Shashank & Schuurman, 2019).
Current Scope
The analyses presented here measure network reachability—that is, where someone can walk within 5, 10, or 15 minutes. They do not yet measure destination accessibility, or what can actually be reached within those travel times.
Future phases of the American Walkability Atlas will evaluate access to destinations such as:
- Parks
- Grocery stores
- Schools
- Libraries
- Transit stops
- Employment centers
- Healthcare facilities
- Civic destinations
Expanding from network reachability to destination accessibility will enable more comprehensive evaluations of neighborhood accessibility and support meaningful comparisons across municipalities. This approach reflects current directions in accessibility and proximity-planning research (Carvalho et al., 2025; Nurse et al., 2025; Jin et al., 2024).
Research Foundation
The Service Area Analysis project is informed by research in:
- Walkability
- Accessibility planning
- GIS network analysis
- Transportation planning
- Urban morphology
- Active transportation
- Built environment research
- The 15-minute city
Other Projects
Municipal Walkability
Compare overall walkability across municipalities using the EPA National Walkability Index.
Neighborhood Walkability
Analyze how walkability varies between neighborhoods within the same city.
Planning Research Report
Review detailed planning reports that use GIS mapping, spatial analysis, and evidence-based research to support planning and policy decisions.
References
- Carvalho, T., Farber, S., Manaugh, K., & El-Geneidy, A. (2025). Assessing the readiness for 15-minute cities: A literature review on performance metrics and implementation challenges worldwide. Transport Reviews, 1–27. https://doi.org/10.1080/01441647.2025.2513530
- Duany, A., Plater-Zyberk, E., & Speck, J. (2010). Suburban Nation: The Rise of Sprawl and the Decline of the American Dream (10th Anniversary). North Point Press.
- Elldér, E. (2024). Built environment and the evolution of the “15-minute city”: A 25-year longitudinal study of 200 Swedish cities. Cities, 149, 104942. https://doi.org/10.1016/j.cities.2024.104942
- Jin, T., Wang, K., Xin, Y., Shi, J., Hong, Y., & Witlox, F. (2024). Is a 15-Minute City Within Reach? Measuring Multimodal Accessibility and Carbon Footprint in 12 Major American Cities. Land Use Policy, 142, 107180. https://doi.org/10.1016/j.landusepol.2024.107180
- Liao, B., Van Den Berg, P. E. W., Van Wesemael, P. J. V., & Arentze, T. A. (2020). Empirical analysis of walkability using data from the Netherlands. Transportation Research Part D: Transport and Environment, 85, 102390. https://doi.org/10.1016/j.trd.2020.102390
- Marquet, O., Mojica, L., Fernández-Núñez, M.-B., & Maciejewska, M. (2024). Pathways to 15-Minute City adoption: Can our understanding of climate policies’ acceptability explain the backlash towards x-minute city programs? Cities, 148, 104878. https://doi.org/10.1016/j.cities.2024.104878
- Nurse, A., Koksal, C., & Sherriff, G. (2025). Beyond the 15-minute city: Methodological lessons for proximity-based planning from two English case studies. Transportation Research Interdisciplinary Perspectives, 32, 101520. https://doi.org/10.1016/j.trip.2025.101520
- Radics, M., Christidis, P., Alonso, B., & dell’Olio, L. (2024). The X-Minute City: Analysing Accessibility to Essential Daily Destinations by Active Mobility in Seville. Land, 13(10), 1656. https://doi.org/10.3390/land13101656
- Rhoads, D., Solé-Ribalta, A., & Borge-Holthoefer, J. (2023). The inclusive 15-minute city: Walkability analysis with sidewalk networks. Computers, Environment and Urban Systems, 100, 101936. https://doi.org/10.1016/j.compenvurbsys.2022.101936
- Shashank, A., & Schuurman, N. (2019). Unpacking walkability indices and their inherent assumptions. Health & Place, 55, 145–154. https://doi.org/10.1016/j.healthplace.2018.12.005
- Staricco, L. (2022). 15-, 10- or 5-minute city? A focus on accessibility to services in Turin, Italy. Journal of Urban Mobility, 2, 100030. https://doi.org/10.1016/j.urbmob.2022.100030
- U.S. Census Bureau. (n.d.). QuickFacts. U.S. Census Bureau. Census.Gov. Retrieved July 20, 2026, from https://www.census.gov/search-results.html
- U.S. Census Bureau. (2026a). Annual Estimates of the Resident Population for Incorporated Places in New Mexico: April 1, 2020 to July 1, 2025 (Version 2025 estimates) [Population estimates; Microsoft Excel (.xlsx)]. U.S. Census Bureau. https://www.census.gov/data/tables/time-series/demo/popest/2020s-total-cities-and-towns.html
- U.S. Census Bureau. (2026b). Annual Estimates of the Resident Population for Incorporated Places in Texas: April 1, 2020 to July 1, 2025 (Version 2025 estimates) [Population estimates; Microsoft Excel (.xlsx)]. U.S. Census Bureau. https://www.census.gov/data/tables/time-series/demo/popest/2020s-total-cities-and-towns.html
- U.S. Census Bureau. (2026c). Annual Estimates of the Resident Population for Incorporated Places of 20,000 or More, Ranked by July 1, 2025 Population: April 1, 2020 to July 1, 2025 (Version Vintage 2025) [Dataset; Microsoft Excel spreadsheet]. U.S. Census Bureau. https://www.census.gov/data/tables/time-series/demo/popest/2020s-total-cities-and-towns.html
- U.S. Census Bureau. (2026d). City and Town Population Totals: 2020–2025. U.S. Census Bureau. https://www.census.gov/data/tables/time-series/demo/popest/2020s-total-cities-and-towns.html
- U.S. Census Bureau. (2026e, May 14). Annual Estimates of the Resident Population for Incorporated Places: April 1, 2020 to July 1, 2025. U.S. Census Bureau. https://www.census.gov/data/tables/time-series/demo/popest/2020s-total-cities-and-towns.html
- Wang, H., Tsoi, K. H., & Loo, B. P. Y. (2025). An assessment framework for 15-minute Cities: Progress worldwide and the impact of urban form. Transportation Research Part A: Policy and Practice, 199, 104583. https://doi.org/10.1016/j.tra.2025.104583
- Weng, M., Ding, N., Li, J., Jin, X., Xiao, H., He, Z., & Su, S. (2019). The 15-minute walkable neighborhoods: Measurement, social inequalities and implications for building healthy communities in urban China. Journal of Transport & Health, 13, 259–273. https://doi.org/10.1016/j.jth.2019.05.005
- Zhang, S., Zhen, F., Kong, Y., Lobsang, T., & Zou, S. (2023). Towards a 15-minute city: A network-based evaluation framework. Environment and Planning B: Urban Analytics and City Science, 50(2), 500–514. https://doi.org/10.1177/23998083221118570