PACM Intersection Study: Project Overview
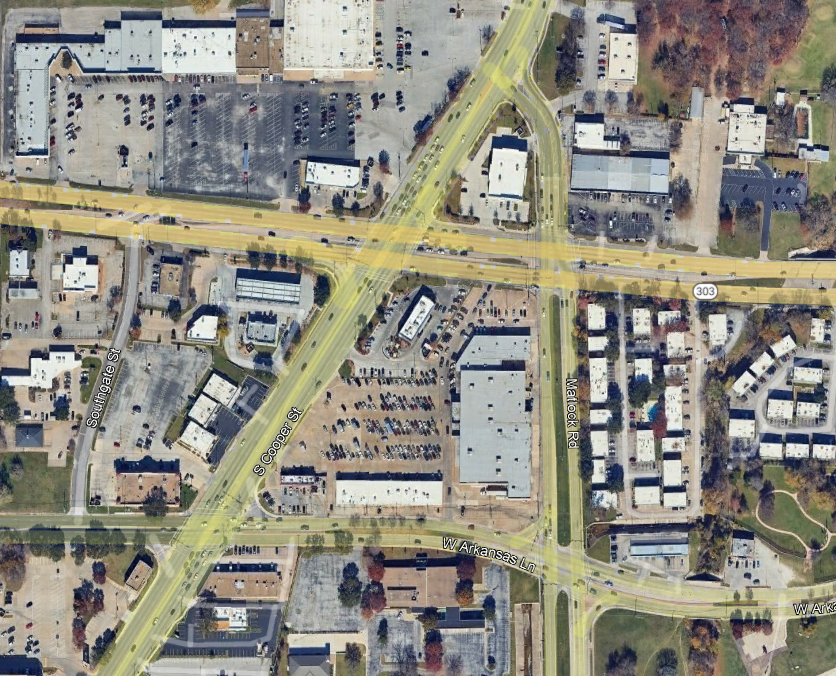
The Pioneer–Arkansas–Cooper–Matlock (PACM) intersection is one of Arlington’s highest-priority intersections for pedestrian safety improvements according to the city’s Safe Streets Arlington initiative. As part of my Master of City and Regional Planning professional report, I evaluated how the built environment influences walkability using the EPA National Walkability Index and GIS analysis.
The study examined block groups within a ¾-mile pedestrian shed surrounding the intersection and compared them with Arlington, the Dallas–Fort Worth Metroplex, Texas, and the United States.
Project Information | |
Location | Arlington, Texas |
Project Type | Master’s Professional Report |
Study Area | ¾-mile pedestrian shed |
Software | ArcGIS Pro |
Data | EPA Smart Location Database |
Analysis Units | Census Block Groups |
Completion | April 2025 |
Skills Demonstrated
- GIS Spatial Analysis
- ArcGIS Pro
- Cartography
- Data Visualization
- Walkability Analysis
- Transportation Planning
- Statistical Comparison
- Urban Design Analysis
- Planning Research
- Technical Writing
Research Questions
- What factors influence walkability at major intersections?
- How PACM compares with other Arlington intersections?
- How Arlington compares with the Dallas–Fort Worth region, Texas, and the nation?
Why I Chose PACM
- High-priority intersection
- Major commercial corridor
- Representative of Arlington’s walkability issues
- Selected because of pedestrian concerns
Methodology
Research Workflow
Literature review
↓
Select study intersection
↓
Download EPA Smart Location Database
↓
Import Census block group shapefiles into ArcGIS Pro
↓
Create ¾-mile pedestrian shed
↓
Analyze four EPA variables
↓
Compare with Arlington
↓
Compare with DFW
↓
Compare with Texas
↓
Compare with United States
↓
Develop planning recommendations
Variables
- Intersection Density
- Proximity to Transit Stops
- Employment Mix
- Employment–Household Mix
Table 1: Variables, Indicators, and Data Sources | ||
Variables | Indicators | Data Sources |
Design | Intersection density | EPA National Walkability Index/Census block groups |
Distance | Proximity to transit stops | EPA National Walkability Index/Census block groups |
Diversity | Employment mix | EPA National Walkability Index/Census block groups |
Diversity | Employment and household mix | EPA National Walkability Index/Census block groups |
Analysis Process & GIS Skills
How the Analysis Was Conducted
To evaluate walkability at the Pioneer–Arkansas–Cooper–Matlock (PACM) intersection, I used the U.S. Environmental Protection Agency’s National Walkability Index and Census block group data. Rather than analyzing only the intersection itself, I examined the surrounding built environment within a ¾-mile pedestrian shed, a commonly accepted walking distance used in urban planning.
The analysis followed six major steps:
- Define the Study Area
A ¾-mile radius was created around the PACM intersection to capture the surrounding Census block groups that influence pedestrian accessibility.
Study Area-Arlington
- Analyze the EPA Walkability Variables
Each block group was evaluated using four variables from the EPA National Walkability Index:
- Intersection Density
- Proximity to Transit Stops
- Employment Mix
- Employment–Household Mix
These variables measure street connectivity, access to transit, and the diversity of land uses that influence walking behavior.
- Calculate Average Walkability
The walkability scores of all block groups within the study area were averaged to produce a single National Walkability Index score representing the PACM intersection.
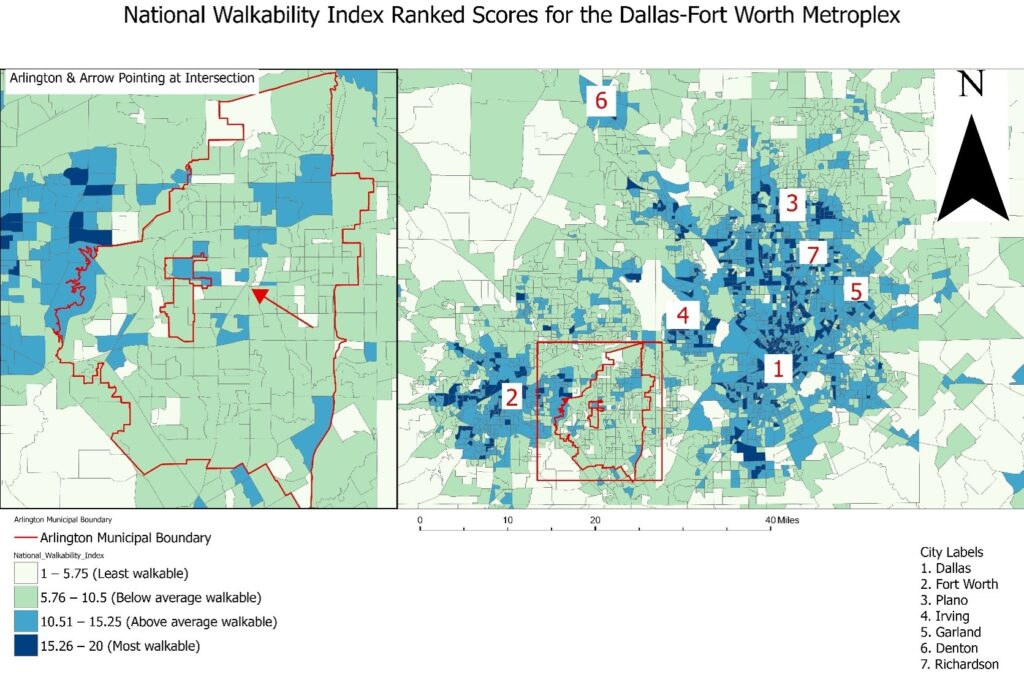
The map below illustrates how Arlington compares to surrounding municipalities. While Dallas, Fort Worth, Plano, Irving, and Denton contain numerous above-average walkability block groups, Arlington contains comparatively fewer high-performing areas.
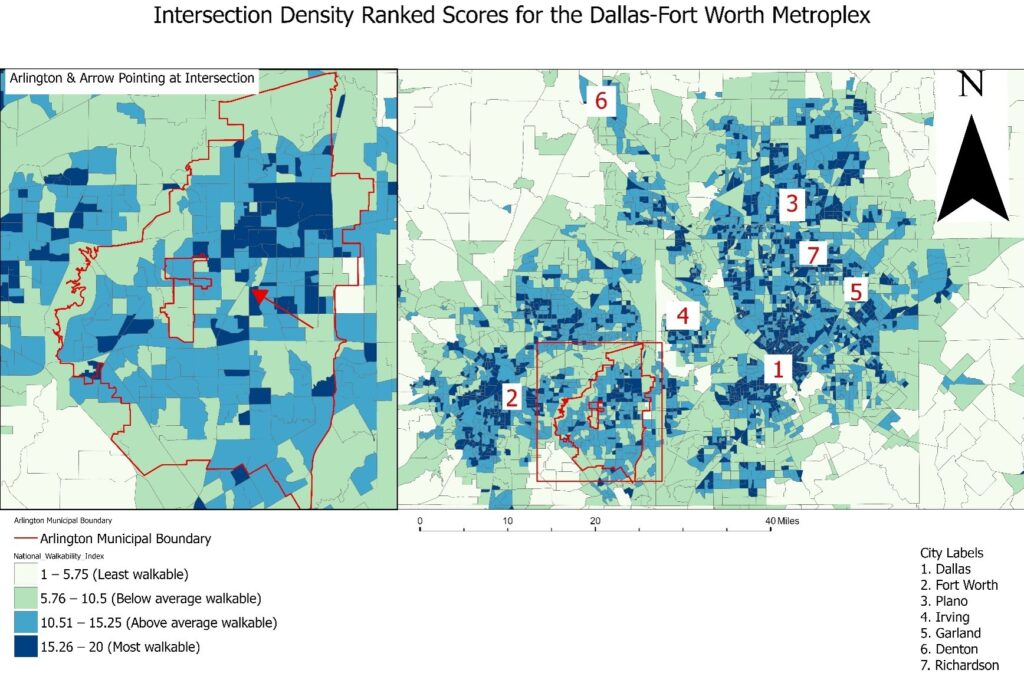
Interestingly, intersection density is not PACM’s greatest weakness. Compared to other variables, the street network performs relatively well, suggesting that connectivity alone is not enough to create walkable environments.
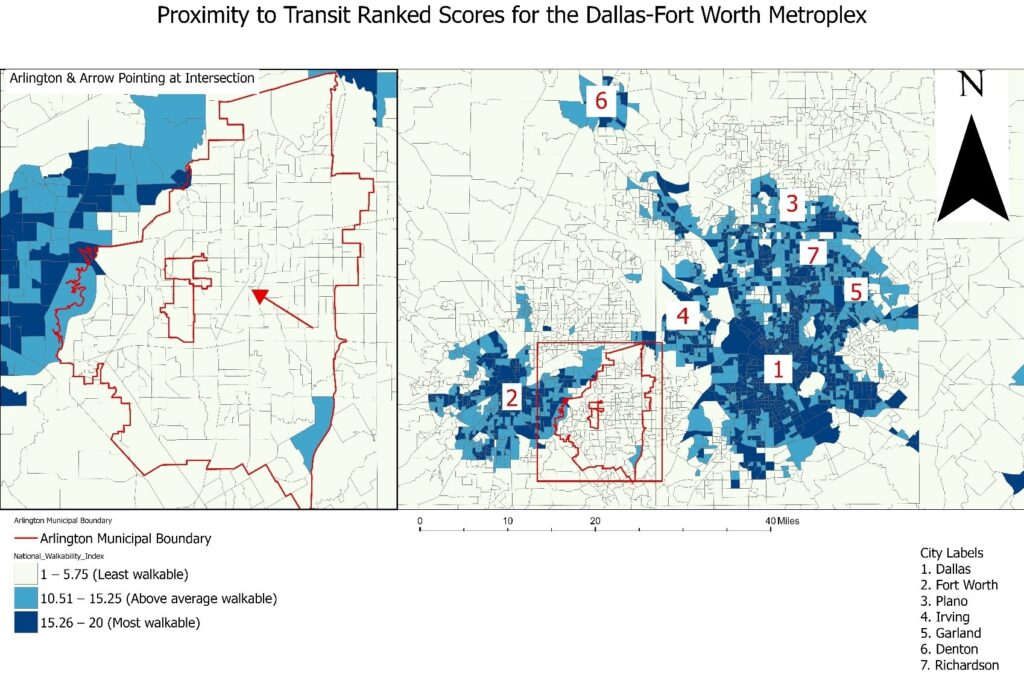
Transit accessibility is by far the weakest variable. Because Arlington lacks a fixed-route transit system, nearly every surrounding block group receives one of the lowest possible transit accessibility scores.
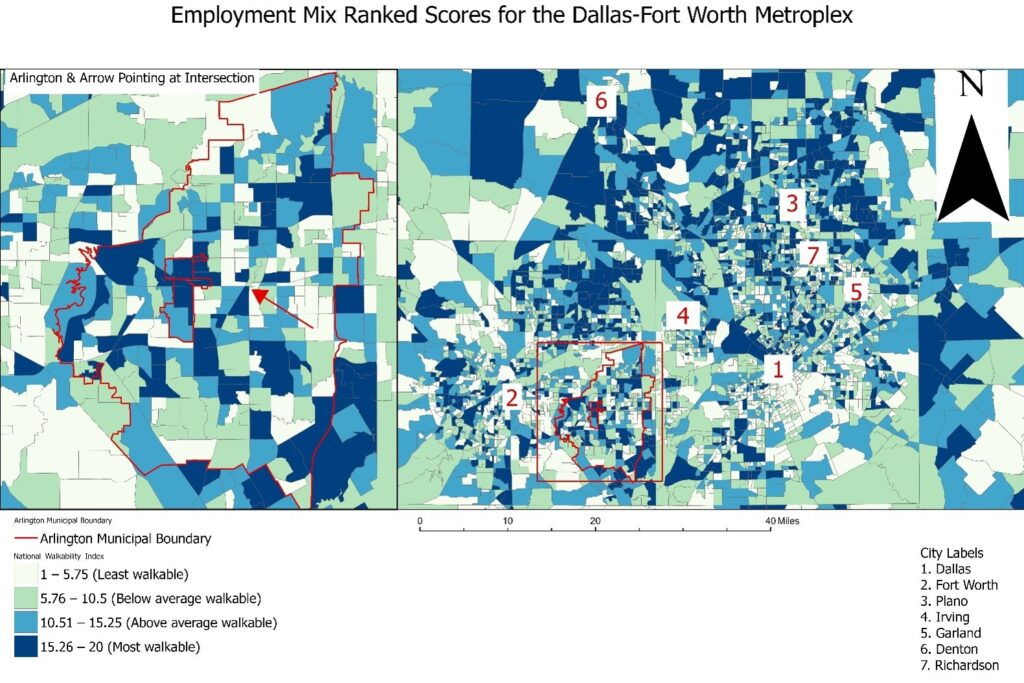
Commercial activity exists throughout the corridor, but the distribution of employment types is less balanced than highly walkable districts.
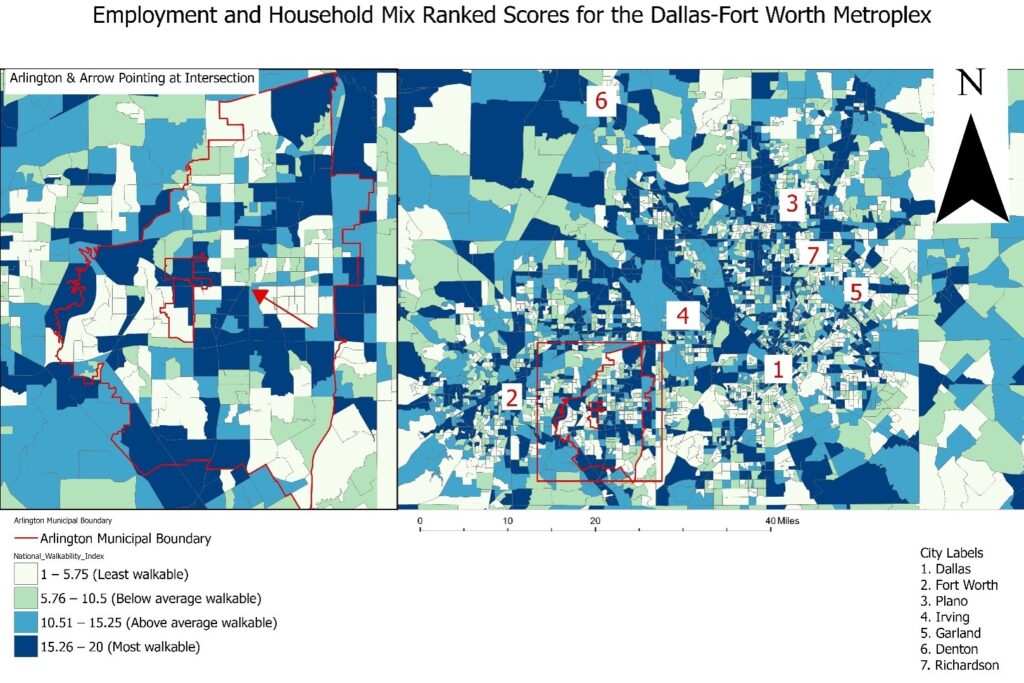
The corridor demonstrates some potential because employment and housing coexist more than transit accessibility alone would suggest.
- Compare with Other Arlington Intersections
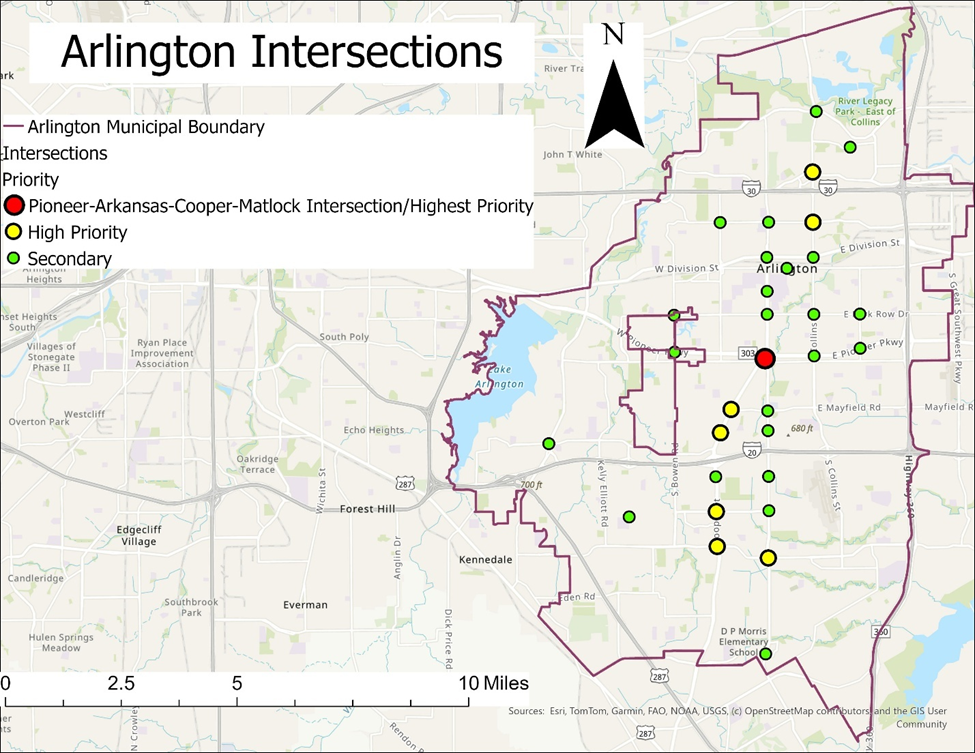
The PACM intersection was then compared with 31 major commercial intersections throughout Arlington, including intersections identified in the Safe Streets Arlington plan as high-priority locations for safety improvements.
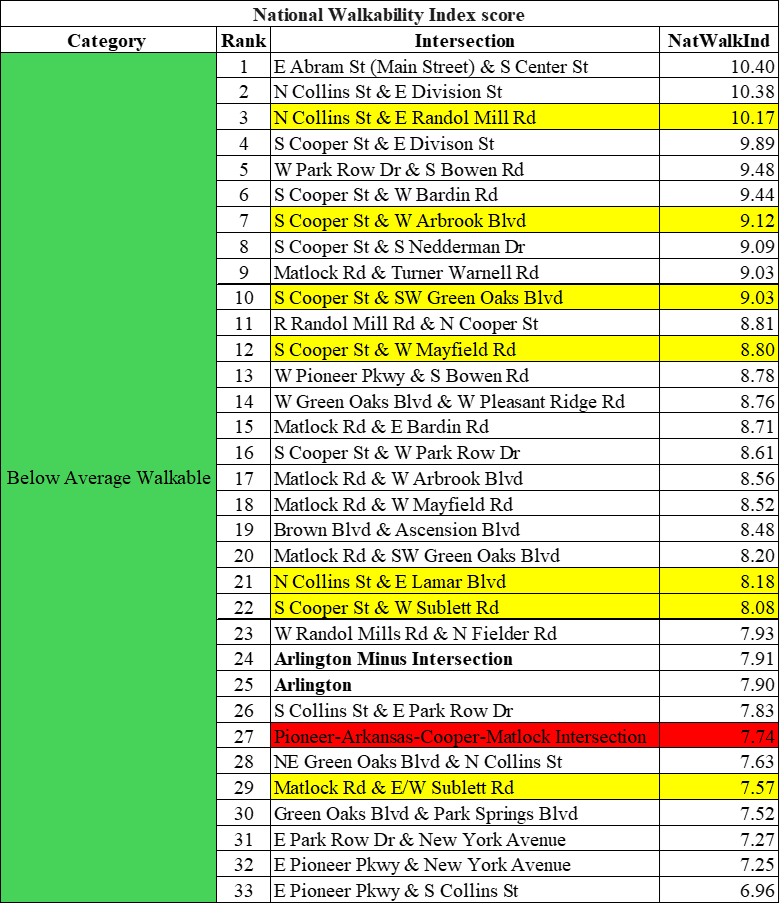
Selected Arlington Intersections
- Compare Across Multiple Geographic Scales
To provide context, the PACM results were compared with:
- The City of Arlington
- The Dallas–Fort Worth Metroplex
- The State of Texas
- The United States
- The 50 largest Metropolitan Statistical Areas (MSAs)
This multi-scale comparison helped determine whether the study area’s walkability reflected local conditions or broader regional and national trends.
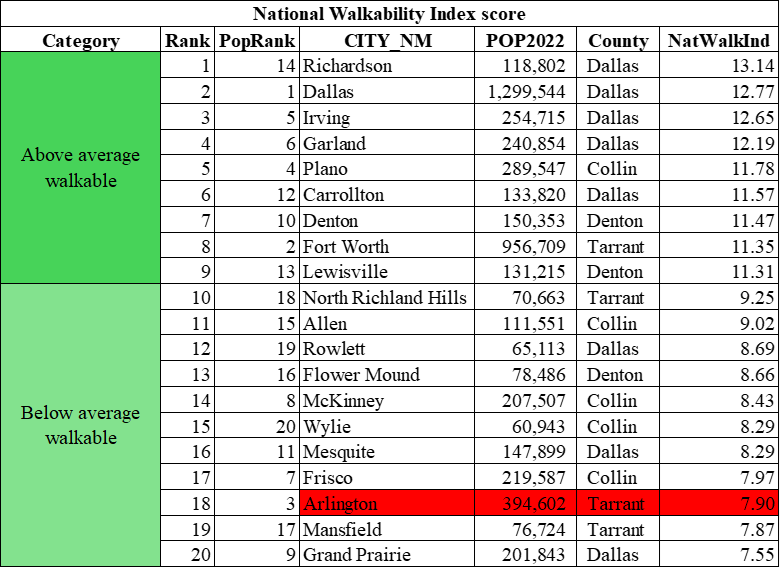
Top 20 DFW Municipalities by Population
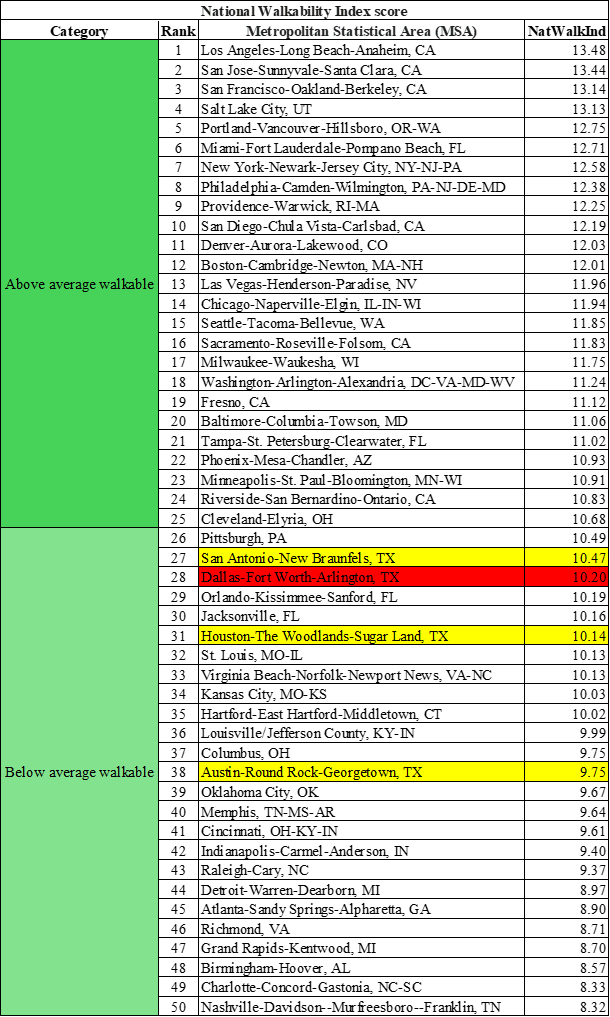
Top 50 Metropolitan Statistical Areas (MSA)
Key Findings:
Overall Walkability
- The PACM study area received a National Walkability Index score of 7.74, indicating opportunities to improve pedestrian accessibility.
Transit Accessibility
- Transit accessibility was the weakest-performing variable, reflecting Arlington’s limited public transit service.
Street Network
- Intersection density performed comparatively well, suggesting that improving connectivity alone is not enough without complementary pedestrian infrastructure.
Regional Context
- Comparisons with Arlington, the Dallas–Fort Worth Metroplex, Texas, and the United States provided context for understanding the study area’s relative walkability.
Field Observations
- Site visits identified missing sidewalks, long crossing distances, wide roadways, and other barriers affecting pedestrian safety and comfort.
Planning Opportunities
- The analysis supports targeted investments in pedestrian infrastructure, transit access, Complete Streets, and mixed-use development to improve walkability.
Planning Recommendations
The analysis identified several opportunities to improve walkability at the Pioneer–Arkansas–Cooper–Matlock intersection. The recommendations below are organized by planning discipline to illustrate how multiple planning strategies can work together to create a safer, more walkable environment.
Infrastructure Improvements
Improve the physical pedestrian environment by:
- Constructing missing sidewalk segments
- Widening existing sidewalks where feasible
- Installing ADA-compliant curb ramps
- Adding pedestrian refuge islands
- Reducing crossing distances
- Improving street lighting
- Increasing street tree coverage and shade
Transportation
Improve multimodal accessibility by:
- Expanding fixed-route transit service
- Improving pedestrian access to transit stops
- Strengthening bicycle connectivity
- Improving sidewalk connections between commercial destinations
- Enhancing signal timing for pedestrians
Land Use
Encourage development patterns that support walking by:
- Promoting mixed-use development
- Increasing residential density near commercial corridors
- Encouraging redevelopment of underutilized commercial parcels
- Creating destinations that reduce automobile dependence
Zoning & Policy
Support long-term walkability through planning policy by:
- Updating zoning regulations to encourage mixed-use development
- Reducing barriers created by conventional Euclidean zoning
- Incorporating walkability into future development review
- Aligning future development with Smart Growth principles
Complete Streets
Apply Complete Streets principles by:
- Designing streets for pedestrians, cyclists, transit users, and motorists
- Narrowing excessively wide travel lanes where appropriate
- Improving pedestrian crossings
- Incorporating traffic-calming features
Transit
One of the report’s strongest findings is that transit accessibility was the weakest component of the National Walkability Index. Improving transit would significantly increase pedestrian accessibility by connecting residents to employment, shopping, and community destinations while supporting investments in sidewalks and other pedestrian infrastructure.
Safety
Improve pedestrian safety through:
- Enhanced crosswalk markings
- Better nighttime lighting
- Reduced vehicle speeds
- Improved intersection design
- Safer parking lot pedestrian connections
- Better visibility at crossings
Long-Term Vision
This project supports planning approaches such as:
- Smart Growth
- New Urbanism
- 15-Minute City
- Safe Streets
- Context-sensitive street design
Together, these strategies can help transform the PACM corridor into a safer, more connected, and more walkable environment while reducing dependence on the automobile. Your report explicitly recommends planning frameworks such as the 15-Minute City, New Urbanism, and Smart Growth to guide future improvements.
My Role
- Conducted the literature review,
- Developed the methodology,
- Analyzed EPA Smart Location Database data,
- Worked with Census block group shapefiles in ArcGIS Pro,
- Performed spatial comparisons across multiple geographic scales,
- Produced original maps,
- Interpreted the results,
- Documented field conditions,
- Developed planning recommendations.
Project Impact
This project demonstrates my ability to combine GIS, national datasets, planning theory, and field observations to evaluate walkability and develop evidence-based recommendations. The methodology can be adapted to analyze other intersections and commercial corridors, providing a practical framework for improving pedestrian accessibility in auto-oriented communities.
Other Projects
Municipal Walkability
Compare overall walkability across municipalities using the EPA National Walkability Index.
Service Area Accessibility
Measure areas reachable within walking time using real pedestrian street networks.
Neighborhood Walkability
Analyze how walkability varies between neighborhoods within the same city.
Planning Research Report
Review detailed planning reports that use GIS mapping, spatial analysis, and evidence-based research to support planning and policy decisions.