Metropolitan Employment Mix Across America
Explore how employment diversity varies across U.S. metropolitan statistical areas (MSAs). Employment Mix is one of the four variables used in the EPA National Walkability Index because communities with a broader mix of employment types often support shorter trips, greater transportation choice, and more walkable environments.
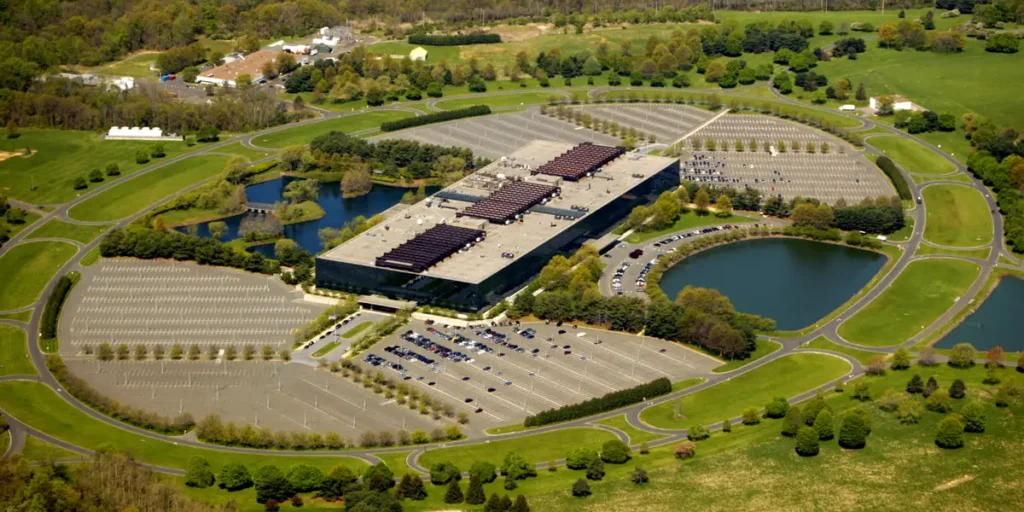
This suburban office park illustrates the single-use zoning and automobile-oriented design common in many suburban employment centers. Offices are surrounded by expansive parking lots and separated from restaurants, retail, and housing, leaving employees with few destinations within walking distance during the workday (Duany et al., 2010). Photo courtesy of Garfield (2017).
Quick Statistics
94
Metropolitan Areas Analyzed
11.9
Average Employment Mix Score
1–20
Observed Employment Mix Range
Other Variables of the National Walkability Index-Municipality Level
Municipal Walkability Index
Compare municipalities using the EPA National Walkability Index to evaluate overall walkability and identify regional patterns across communities.
Municipal Intersection Density
Analyze street network connectivity by measuring intersection density across municipalities to understand how street design influences walkability.
Municipal Transit Accessibility
Evaluate municipal access to public transportation by measuring proximity to transit stops and identifying areas with stronger multimodal connectivity.
Municipal Jobs & Housing Mix
Measure the relationship between employment and household distribution to evaluate land use balance and support planning decisions.
Further Reading
Key Takeaways
- Municipal employment mix varies considerably across the United States.
Municipal employment mix scores range from 1 to 20, demonstrating substantial variation in the balance between employment opportunities and residential development across municipalities. Some communities maintain a relatively balanced jobs-to-housing relationship, while others function primarily as residential suburbs or employment centers. - Most municipalities exhibit moderate employment mix scores.
While some municipalities achieve very high employment mix scores, indicating a well-balanced distribution of jobs and housing, many communities receive moderate or lower scores, reflecting varying degrees of specialization as residential, commercial, or industrial areas rather than balanced mixed-use environments. - Employment mix is unevenly distributed across regions.
Municipal employment mix scores differ substantially across Census regions, states, metropolitan areas, and municipalities. These differences reflect variations in local economic structure, land-use patterns, zoning practices, and historical development, with considerable variation occurring both within and between metropolitan areas. - Municipal employment mix scores provide a useful benchmark but should be interpreted with caution.
Each score represents an average across an entire municipality and may mask important neighborhood-level differences. A municipality with a moderate overall employment mix score may still contain highly mixed-use districts alongside predominantly residential or employment-focused areas. - Employment mix can inform land-use and economic development decisions.
Comparing municipal employment mix scores can help planners, researchers, and local governments identify opportunities to improve the balance between jobs and housing, encourage mixed-use development, reduce commuting distances, strengthen local economies, and create more complete and resilient communities.
Distribution of EPA Employment Mix Scores

Distribution of EPA Employment Mix Scores for U.S. Cities:
- Sample size (6,255 cities)
- Mean = 11.9
- Median = 11.88
- Min = 1
- Max = 20
- SD = 3.44
Municipal Employment Mix Analysis
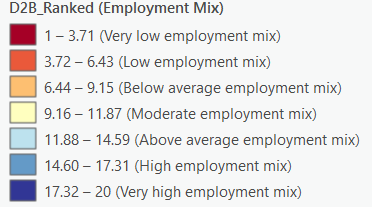
The employment-mix indicator classifies municipalities into seven categories based on the relative balance and concentration of employment opportunities within the built environment. The scores represent municipal averages of the U.S. Environmental Protection Agency’s ranked employment-mix variable, D2B_Ranked, which ranges from 1 to 20. Higher scores generally indicate a greater diversity and accessibility of employment opportunities within or near residential areas, while lower scores indicate more limited employment diversity or greater separation between places of employment and residential neighborhoods.
Unlike the complete National Walkability Index, employment mix measures only one component of walkability. A municipality may have a diverse employment base while lacking connected streets, transit service, or pedestrian infrastructure. Likewise, a municipality with relatively few employment opportunities may still provide highly walkable residential neighborhoods if other aspects of the built environment support walking.
Classification Categories
- Very High Employment Mix (17.32–20.00): Municipalities with exceptionally diverse employment opportunities located near residential areas. Residents generally have access to a wide variety of workplaces within relatively short distances, supporting both walking and shorter commute trips.
- High Employment Mix (14.60–17.31): Municipalities with a strong balance between employment opportunities and residential development. Multiple employment centers and mixed-use districts provide convenient access to jobs throughout the community.
- Above Average Employment Mix (11.88–14.59): Municipalities with a healthy distribution of employment opportunities serving a broad portion of residents. Employment may be concentrated in commercial corridors, downtown districts, or multiple activity centers.
- Moderate Employment Mix (9.16–11.87): Municipalities where employment opportunities are present but unevenly distributed. Some neighborhoods may have convenient access to jobs while others remain primarily residential.
- Below Average Employment Mix (6.44–9.15): Municipalities where employment opportunities are relatively limited or concentrated in only a few locations. Many residents travel outside the municipality for work.
- Low Employment Mix (3.72–6.43): Municipalities with relatively few employment destinations compared to residential development. Land uses are generally separated, resulting in greater commuting distances and increased dependence on automobiles.
- Very Low Employment Mix (1.00–3.71): Municipalities with extremely limited employment diversity or very small employment bases. Most residents must travel outside the municipality to reach major employment centers.
Planning Implications
Employment mix is an important component of walkability because the proximity and diversity of workplaces influence travel behavior and the number of destinations that can be reached without relying exclusively on automobiles. Communities that combine employment, housing, retail, and services within close proximity generally encourage shorter trips and increase opportunities for walking, bicycling, and transit use.
Higher-scoring municipalities generally provide:
- Greater access to employment opportunities within or near residential neighborhoods.
- More opportunities for walking, bicycling, or using public transit for work-related trips.
- Shorter average travel distances between homes and workplaces.
- Greater support for mixed-use development and complete communities.
- Increased economic resilience through a diversified employment base.
- Reduced dependence on long automobile commutes.
Lower-scoring municipalities may improve employment accessibility by encouraging mixed-use zoning, supporting infill development, attracting employment centers near existing residential neighborhoods, redeveloping underutilized commercial properties, and coordinating transportation investments with economic development initiatives.
Employment mix alone does not guarantee walkability. Residents must also have connected street networks, sidewalks, safe crossings, public transit, and nearby daily destinations for employment opportunities to translate into practical walking options.
Understanding Municipal Employment Mix
Municipal employment-mix scores provide a standardized way to compare one aspect of land-use diversity across communities. The data represent municipal averages of the EPA’s ranked employment-mix indicator rather than direct measures of total employment or economic output.
Unlike transit accessibility or intersection density, employment mix often reflects local economic structure as much as urban form. Municipalities with substantial office districts, institutional campuses, industrial centers, commercial corridors, or mixed-use downtowns generally receive higher scores because employment opportunities are more broadly distributed across the community.
For example, Portland (14.25), Boise (14.15), Port St. Lucie (13.61), Orlando (12.27), Raleigh (12.05), San Francisco (12.85), and Colorado Springs (11.88) receive relatively high employment-mix scores, reflecting diversified employment opportunities within their municipal boundaries.
Conversely, municipalities such as Detroit (5.32), Baltimore (6.98), New Orleans (6.98), Toledo (7.55), Chicago (8.47), Dallas (8.48), and Cleveland (6.48) receive lower employment-mix scores despite their regional economic importance, illustrating that municipal averages do not necessarily capture the full complexity of metropolitan employment patterns.
Municipal averages should therefore be interpreted cautiously. Individual municipalities often contain employment clusters, industrial districts, central business districts, and predominantly residential neighborhoods whose local conditions differ substantially from the municipal average.
Geographic Patterns in Municipal Employment Mix
Employment-mix scores reveal distinctive geographic patterns influenced by economic specialization, land-use planning, suburban growth, and metropolitan development.
- Major Metropolitan Areas: Large metropolitan municipalities generally record moderate to above-average employment-mix scores because they contain a broad range of employment sectors, including offices, retail, education, healthcare, manufacturing, and government services.
- Central Cities: Many traditional downtown municipalities maintain diverse employment opportunities, although municipal boundaries and surrounding suburban job growth can influence overall scores.
- Suburban Employment Centers: Some suburban municipalities achieve relatively high employment-mix scores due to the development of regional office parks, corporate campuses, medical centers, airports, and commercial corridors that provide substantial employment opportunities independent of the central city.
- Rapidly Growing Sun Belt Communities: Employment-mix scores vary considerably throughout rapidly expanding metropolitan regions. Some municipalities have successfully integrated employment growth with residential development, while others remain primarily residential communities with many residents commuting elsewhere for work.
- Small Towns and Rural Communities: Employment-mix scores are often lower where economic activity is concentrated in a limited number of industries or where residents depend on nearby cities for employment.
These patterns demonstrate that employment mix reflects both urban form and regional economic development. Municipalities with similar populations may receive substantially different scores depending on the diversity and location of employment opportunities within their boundaries.
Relationship to Walkability
Employment mix represents one of the three fundamental components of the National Walkability Index because land-use diversity strongly influences travel behavior. Communities where employment opportunities are located near housing, shopping, services, schools, and recreation reduce the need for long automobile trips while increasing opportunities for walking and other forms of active transportation.
Cervero and Kockelman (1997) identified density, diversity, and design as three primary built-environment characteristics influencing travel demand. Their “3Ds” framework established land-use diversity as a key factor affecting mode choice and trip length. Ewing and Cervero (2010) subsequently confirmed through a meta-analysis that mixed land uses are consistently associated with increased walking, transit use, and reduced vehicle travel. Frank et al. (2006) similarly found that neighborhoods combining diverse land uses with connected street networks and transit accessibility support healthier travel behaviors and greater physical activity.
Because employment mix captures only one dimension of land-use diversity, it should be interpreted alongside intersection density and transit accessibility to provide a more complete understanding of municipal walkability.
Overall Pattern
Municipal employment-mix scores illustrate how the distribution of jobs influences accessibility across American communities. Municipalities with balanced residential and employment development generally receive higher scores because residents have greater access to workplaces within shorter travel distances. Communities dominated by residential development or limited employment opportunities generally receive lower scores, reflecting greater dependence on regional commuting patterns.
Employment mix should therefore be viewed as an indicator of land-use diversity rather than economic performance. High scores do not necessarily indicate larger economies, nor do low scores imply economic decline. Instead, the measure evaluates how closely employment opportunities are integrated with residential development and how effectively municipal land-use patterns support walking, shorter trips, and multimodal transportation.
Relationship to Walkability
The EPA stresses that Employment Mix is only one component of walkability.
A neighborhood could have:
- high Employment Mix
- poor street connectivity
- little transit
and therefore still not be highly walkable.
Likewise:
- excellent intersections
- good transit
- but only warehouses
would also limit walking.
The National Walkability Index combines:
- Intersection Density
- Transit Proximity
- Employment Mix
- Employment–Household Mix
into one composite score (U.S. Environmental Protection Agency, 2021b, 2021a).
Employment Categories
The EPA’s Employment Mix Index is calculated using employment data from the U.S. Census Bureau’s Longitudinal Employer-Household Dynamics (LEHD) program. Jobs are grouped into eight major employment categories to measure the diversity of employment opportunities within a metropolitan area. A higher mix indicates a broader range of employment types located within the region.
Then include the list:
- Retail
- Office
- Industrial
- Service
- Entertainment
- Education
- Healthcare
- Public Administration
These employment categories are derived from LEHD employment data and form the basis of the EPA’s Employment Mix Index methodology (U.S. Environmental Protection Agency, 2021b).
Visual Example
Neighborhood | Employment Pattern | Employment Mix |
Office Park | 90% office jobs | Low |
Shopping District | Mostly retail | Low |
Downtown | Retail + Office + Healthcare + Restaurants + Entertainment + Education | High |
Planning Applications
Employment Mix can help planners:
- Identify areas dominated by a single employment sector.
- Evaluate mixed-use development proposals.
- Compare downtowns, suburban centers, and employment corridors.
- Monitor changes in land-use diversity over time.
- Support comprehensive planning, transportation planning, and economic development initiatives.
Using Employment Mix Maps
The American Walkability Atlas allows users to compare Employment Mix across metropolitan statistical areas. These maps can reveal patterns such as concentrated downtown business districts, suburban office parks, industrial corridors, and mixed-use neighborhoods, helping users better understand how employment diversity varies throughout a region.
Other Takeaways
Employment Mix measures the diversity of employment types rather than the number of jobs in a neighborhood. Areas with a balanced mix of employment opportunities generally provide a wider variety of nearby destinations, making walking for everyday activities more practical.
Entropy
Employment Mix is calculated using an entropy-based index, where higher values indicate a more even distribution of employment across multiple categories (U.S. Environmental Protection Agency, 2021).
High Employment Mix
Characteristics
Balanced representation of multiple employment categories
Typically found in dense downtowns, mixed-use districts, and major commercial corridors
Workers and visitors come for many purposes: office, retail, restaurants, entertainment, healthcare, education
Examples
1. Midtown Manhattan, New York, NY
Heavy concentration of office towers, retail, dining, entertainment, hotels, & services.
Very high diversity of job types in small geographic areas.
2. Downtown Chicago (The Loop), Chicago, IL
Finance, government jobs, law offices, retail, restaurants, higher education, and cultural institutions.
Extremely high job diversity.
3. Downtown Portland, OR
Employment spans government, service, retail, office, education, and tech.
4. Uptown/Downtown Dallas, TX
Jobs in finance, law, technology, restaurants, medical centers, and retail — all within close range.
These locations score near the top end of the Employment Mix variable in the SLD.
Moderate Employment Mix
Characteristics
Some diversity of employment, but a couple of sectors dominate.
Often in suburban commercial arteries, university districts, or small downtowns.
Examples
1. Tempe, AZ – Near ASU
Education jobs + retail + food services + some office space create moderate employment balance.
2. Arlington, TX – Near UT Arlington & Downtown District
Mix of university jobs, local government, restaurants, small offices, and retail.
More varied than a single-sector job center, but not as diverse as a major downtown.
3. Walnut Creek, CA – Suburban Commercial Core
Retail + office + services, but fewer industrial or institutional jobs.
4. Midtown Memphis, TN
Medical district + local retail + small offices, producing a mid-level job mix.
Low Employment Mix
Characteristics
Dominated by a single employment category
Often located in:
Industrial parks
Warehousing/distribution districts
Retail shopping centers
Office parks
Very limited walkability because uses are separated.
Examples
1. Suburban Big-Box Retail Clusters (e.g., Katy Freeway, Houston, TX)
Mostly retail and food service; limited office or industrial employment.
2. Industrial Districts in Long Beach, CA
Port-related warehousing, shipping, and manufacturing dominate.
3. Silicon Valley Office Parks (Sunnyvale / Mountain View, CA)
Tech-heavy campuses with little retail or service employment in the immediate area.
4. Fort Worth Alliance Area, TX
Distribution and logistics jobs dominate, often producing very low employment mix.
Resources
- Cervero, R., & Kockelman, K. (1997). Travel demand and the 3Ds: Density, diversity, and design. Transportation Research Part D: Transport and Environment, 2(3), 199–219. https://doi.org/10.1016/S1361-9209(97)00009-6
- Duany, A., Plater-Zyberk, E., & Speck, J. (2010). Suburban Nation: The Rise of Sprawl and the Decline of the American Dream (10th Anniversary). North Point Press.
- Frank, L. D., Sallis, J. F., Conway, T. L., Chapman, J. E., Saelens, B. E., & Bachman, W. (2006). Many Pathways from Land Use to Health: Associations between Neighborhood Walkability and Active Transportation, Body Mass Index, and Air Quality. Journal of the American Planning Association, 72(1), 75–87. https://doi.org/10.1080/01944360608976725
- Garfield, L. (2017, August 28). Corporations are killing suburban office parks, so people have started living in them. Business Insider. https://www.businessinsider.com/suburban-office-parks-housing-2017-8
- U.S. Environmental Protection Agency. (2021a). National Walkability Index: Methodology and User Guide. U.S. Environmental Protection Agency (EPA). https://www.epa.gov/smartgrowth/smart-location-mapping#walkability
- U.S. Environmental Protection Agency. (2021b). Smart Location Database (SLD) 3.0: Technical Documentation and User Guide. U.S. Environmental Protection Agency. https://www.epa.gov/smartgrowth/smart-location-mapping#SLD